

Disclosure: TDMM is a crypto proprietary trading firm and market maker. Several of the strategies described here are things TDMM runs on its own balance sheet, and TDMM also offers market making as a contracted service to token projects. We say so at the top, publish our method and data, and keep the measurements separate from the sales pitch.
The short answer
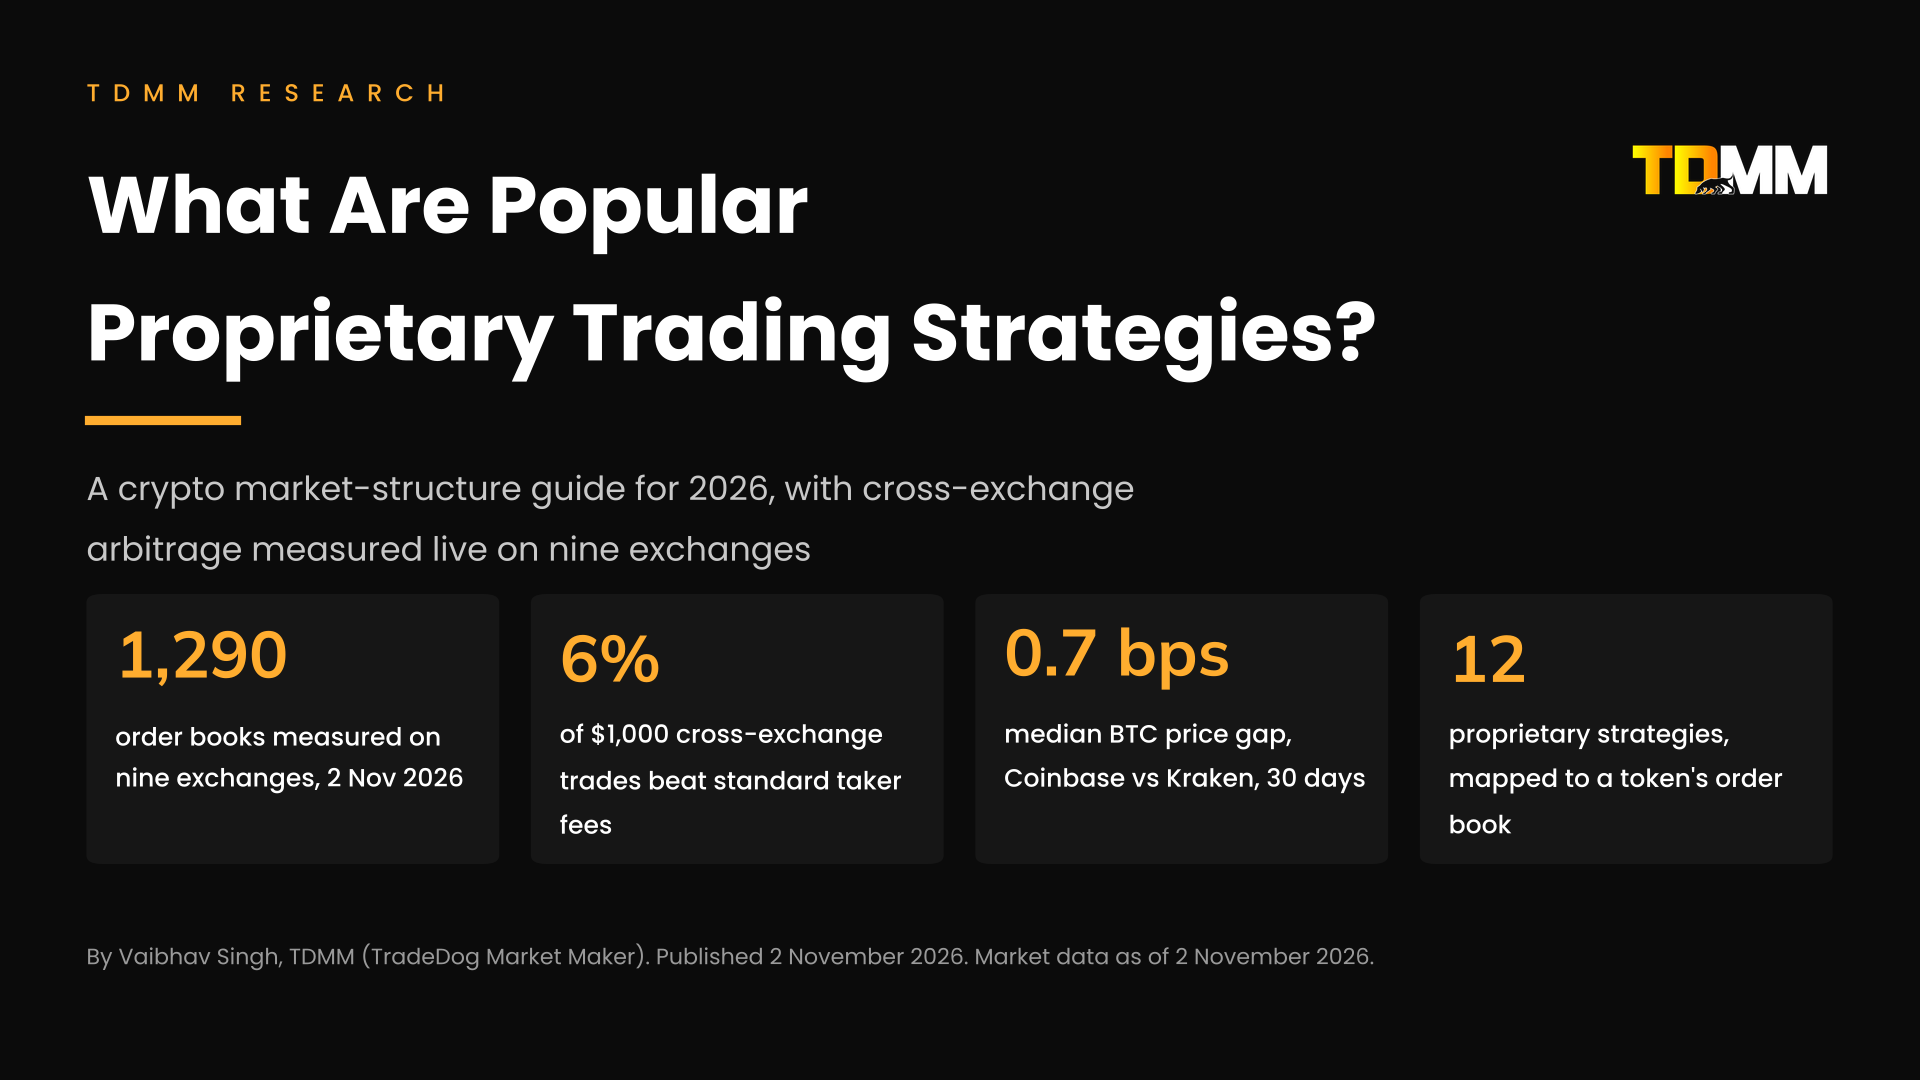
Popular proprietary trading strategies are the ways a firm trades its own capital for its own profit: market making, cross-exchange arbitrage, triangular arbitrage, statistical arbitrage, basis and funding-rate carry, momentum and trend following, latency arbitrage, MEV and on-chain arbitrage, liquidation and event-driven trading, volatility and options strategies, ETF arbitrage and systematic grid trading. In crypto, market making, cross-exchange arbitrage and the basis trade carry most of the capital. TDMM measured 1,290 order books across nine exchanges on 2 November 2026: a cross-exchange gap was visible in 68% of $1,000 trades, it beat standard fees in only 6%, and almost nothing crossed at $100,000. TDMM runs several of these strategies on its own balance sheet as a proprietary trading firm, and offers contracted market making to token projects across exchanges and DEX pools from one reference price. The strategies TDMM trades for itself are the same technology it deploys for the projects it quotes under contract.
Key takeaways
- “Prop trading” means three different things, and only one trades for you. A proprietary desk trades its own balance sheet; a funded-trader “prop firm” sells evaluation accounts to retail traders; a market making mandate is a firm quoting a token under contract to its issuer. The strategies in this guide belong to the first group. Token projects hire the third.
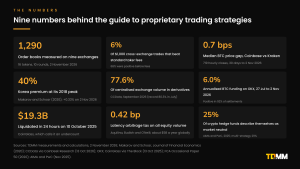
- Cross-exchange arbitrage still exists; the profit mostly does not. Across 1,290 live order books on nine exchanges, a buy-here-sell-there gap was positive before fees in 68% of $1,000 trades. In only 6% of token-rounds did it beat two standard taker fees; 26% beat an institutional tier of two basis points a leg, and at $100,000 the median best gap was -21.2 basis points.
- The gaps that remain live on thin venues for long-tail tokens. Mid-price dispersion across venues was under six basis points for ETH, SUI, AVAX, XRP, SOL and BTC and 293 basis points for OP, where one exchange quoted a spread of about 240 basis points with nothing inside 1% of the mid price. Arbitrage takes those orders. It does not replace them.
- Convergence is almost complete on the deep books. Over 719 hourly closes in the 30 days to 2 November 2026, Coinbase and Kraken priced Bitcoin within a median 0.7 basis points of each other. From December 2017 to early February 2018 the Korea premium averaged about 15% and touched 40%; on 2 November 2026 it was +0.33%.
- The basis trade paid 4% to 6% a year in the second half of 2026. Funding on OKX’s BTC perpetual swap annualised at 6.0% from 27 July to 2 November, positive in 92% of settlements. Ethena’s USDe, the industrialised version of the trade, shrank from about $14.8 billion of supply in October 2025 to $4.49 billion on 2 November 2026.
- Trend following changed the shape of returns; mean reversion had a high hit rate and poor expectancy. On Coinbase daily data, a 90-day momentum rule cut Bitcoin’s maximum drawdown from 77% to 57%. A two-standard-deviation mean-reversion rule won 74% of its Bitcoin trades and returned +23% against +494% for holding.
- Speed is a tax on everyone else. The UK regulator’s study of latency arbitrage put the cost at 0.42 basis points of all volume, about $5 billion a year globally, with races decided in 5 to 10 microseconds. Crypto exchanges run the same race without publishing matching-engine latencies.
- Rules now police conduct, not strategy. Binance’s 25 March 2026 guidance prohibits profit-sharing and guaranteed-profit market making deals and requires disclosure of a project’s market maker. US courts have sentenced CLS Global, Gotbit’s founder and MyTrade’s founder for wash trading. MiCA’s market abuse title applies to anyone trading a listed crypto-asset, inside or outside the EU.
- Every strategy here trades your token whether you like it or not. The only one whose job is the order book, and the only one that answers to the project, is contracted market making. TDMM runs that service alongside a proprietary trading book of its own, across CEX books and DEX pools, from one reference price, with spread, depth and uptime written per venue for the projects it quotes.
What is proprietary trading, and what is it not?
Proprietary trading is a firm trading with its own capital for its own account. There is no client whose order is being executed and no investor whose money is being managed. The firm takes the position, carries the inventory and keeps the profit or the loss. Jane Street, Jump Trading, Hudson River Trading, Citadel Securities, DRW, Flow Traders, Optiver and IMC are proprietary trading firms in traditional markets; Wintermute, GSR, Cumberland, B2C2 and Keyrock are among the firms that run proprietary books in crypto, usually alongside client-facing OTC desks.
The term carries a regulatory history. Section 619 of the US Dodd-Frank Act of 2010, the Volcker Rule, barred banking entities from proprietary trading and from owning or sponsoring hedge funds and private equity funds, with exemptions for market making, underwriting and hedging. The five agencies finalised the rule in December 2013 and simplified it in 2019 and 2020. Its practical effect was to move risk-taking from bank balance sheets to non-bank firms, which is why “prop trading” today describes a set of specialist firms rather than a desk inside a bank. In crypto the line has moved again in 2025: the Office of the Comptroller of the Currency told national banks in March 2025 that they no longer need supervisory non-objection for permitted crypto activities, in May 2025 that they may buy and sell custodied crypto at a customer’s direction, and in December 2025 that they may act as riskless principal in crypto transactions. None of those letters permits a bank to hold crypto inventory and quote it for its own account; that question still sits under the Volcker market-making exemption and belongs with counsel.
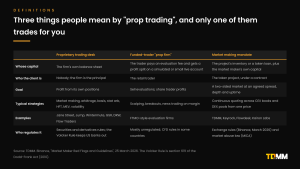
Two other things borrow the name, and the confusion is worth clearing before the strategies.
Funded-trader “prop firms.” Most of what ranks for “prop trading strategies” is written for retail traders paying an evaluation fee to a firm that promises a share of profits on a simulated or small live account. The strategies those pages describe are discretionary: scalping, breakouts, news trading on margin. The industry has had a rough three years. The CFTC’s 2023 case against My Forex Funds, which alleged about $310 million in fees taken from more than 135,000 customers, was dismissed with prejudice on 13 May 2025 after a court found misconduct by the agency, not because the business model was vindicated. The Funded Trader paused operations in March 2024, True Forex Funds closed in May 2024, and more closures followed in 2026, while the best-known firm, FTMO, completed its acquisition of the broker OANDA on 1 December 2025. None of this touches a token’s order book. It is a different industry that happens to share two words.
Market making mandates. A crypto market maker trades its own capital, but under contract to a token issuer, on named venues, to an agreed spread, depth and uptime, paid by a retainer or by options on a token loan. Binance’s 25 March 2026 guidance formalised the line: profit-sharing and guaranteed-profit models with market makers are prohibited, loan agreements must define the permitted use of tokens, and projects must disclose the market maker’s identity, legal entity and terms to the exchange. The service is proprietary technology deployed for a client, which is the subject of the final sections of this guide. TDMM’s comparison of a crypto market maker and a liquidity provider covers the contractual forms.
Why do proprietary trading strategies matter to a token project?
Because they are the other side of the order book. A token listed on five exchanges and two DEX pools is being traded, from the first second, by firms running most of the strategies below. Arbitrageurs align its price across venues. Latency desks pick off whoever quotes it slowly. Basis desks short its perpetual against spot. Momentum desks buy its rallies and sell its drawdowns. Event desks wait for its unlocks. None of them has a contract with the project, and none of them owes it a spread, a depth or a price that is the same on every venue.
The purpose of this guide is to describe each strategy as a practitioner would, with published evidence and TDMM’s own measurements, and then to ask one question of each: what does it do to a token’s liquidity? The answers decide what kind of liquidity partner a project needs. TDMM runs many of these strategies on its own balance sheet, and in parallel offers cross-exchange market making as a contracted service to token issuers; the proprietary book is how the firm stays sharp on the venues and the technology, and the service is how that work reaches a project.
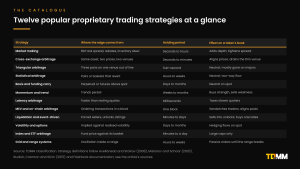
The popular proprietary trading strategies at a glance
|
Strategy |
Where the edge comes from |
Holding period |
Capital and technology |
Effect on a token’s book |
|
Market making |
Bid-ask spread, rebates, inventory skew |
Seconds to hours |
Inventory on every venue; low-latency quoting |
Adds depth; tightens spread |
|
Cross-exchange arbitrage |
Same asset, two prices, two venues |
Seconds to minutes |
Pre-funded balances on both venues |
Aligns prices; drains the thin venue |
|
Triangular arbitrage |
Three pairs on one venue out of line |
Sub-second |
Co-located bots; low fee tier |
Neutral; mostly gone on majors |
|
Statistical arbitrage and pairs trading |
Spreads between related assets that revert |
Hours to weeks |
Models, borrow, many pairs |
Neutral; two-way flow |
|
Basis and funding carry |
Perpetual or futures priced above spot |
Days to months |
Spot plus derivatives margin |
Neutral on spot; shorts the perpetual |
|
Momentum and trend following |
Trends persist |
Weeks to months |
Low; directional risk |
Buys strength, sells weakness |
|
Latency arbitrage |
Reacting before resting quotes update |
Milliseconds |
Co-location; fastest feeds |
Taxes slower quoters; widens spreads |
|
MEV and on-chain arbitrage |
Ordering transactions in a block |
One block |
Searchers, builders, gas bidding |
Sandwiches DEX traders; aligns pools |
|
Liquidation and event-driven |
Forced sellers, unlocks, listings |
Minutes to days |
Capital ready at the event |
Sells into unlocks; buys cascades |
|
Volatility and options |
Implied against realised volatility |
Days to months |
Options margin; hedging engine |
Hedging flows on spot |
|
Index and ETF arbitrage |
Fund price against its basket |
Minutes to a day |
Authorised participant status |
Large caps only |
|
Grid and range systems |
Oscillation inside a range |
Hours to weeks |
Low; exchange bots |
Passive orders until the range breaks |
Holding periods and capital intensity are typical ranges, not rules. Source: TDMM classification; definitions follow the sources listed at the end.
The rest of this guide takes the strategies in turn, with the most space given to the two that touch a token’s order book most directly: market making and cross-exchange arbitrage.
How does market making work as a proprietary strategy?
Market making is the business of being the counterparty of first resort. The firm posts a bid and an ask around the price it believes is fair, earns the spread when both sides trade, and manages the inventory that builds up when they do not. The theory is older than crypto. Avellaneda and Stoikov’s 2008 model, which most crypto quoting engines still descend from, gives the market maker a reservation price that drifts away from the mid as inventory grows, and a spread that widens with volatility, with the time left in the trading session and with the firm’s own risk aversion. Quote wider and you trade less but hold less risk; quote tighter and you trade more but carry more inventory into the next move. The second risk is adverse selection: the trader who hits your quote often knows something you do not, so your fills cluster just before the price moves against you.
In crypto the strategy runs 24 hours a day across many venues, which changes two things. Inventory has to be held on every exchange the firm quotes, because transfers take minutes and the quote has to be live now. And the venues are deeply unequal. Kaiko’s 2023 concentration report found that the top eight exchanges held 91.7% of global order book depth and 89.5% of volume, with Binance alone at 30.7% of depth. CCData’s exchange review for September 2026 put Binance at 28.5% of centralised spot volume and 45.3% of derivatives, and derivatives at 77.6% of all centralised exchange volume, after a record 80.3% in July. A proprietary market maker chooses the venues and tokens where the spread pays; nothing obliges it to quote the venue where a token is thin, and in stress it is paid to leave.
That is the difference between market making as a proprietary strategy and market making as a service. The quoting engine is the same. The obligation is not. TDMM’s guide to how market making works in crypto exchanges covers the mechanics; the contracted version is the subject of the final sections here.
What is cross-exchange arbitrage, and does it still pay in 2026?
Cross-exchange arbitrage is the simplest proprietary trading strategy to describe and one of the hardest to run at scale. The same token trades on dozens of exchanges. When the best bid on one exchange sits above the best ask on another, a desk that holds balances on both can buy on the cheaper venue and sell on the dearer one in the same second, keeping the difference. No view on price is needed. The edge is in connectivity, pre-funded inventory on every venue, fee tier and speed.
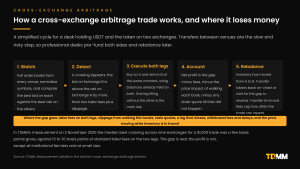
How TDMM measured it
Between 11:54 and 12:04 UTC on 2 November 2026, TDMM captured the full visible level-2 order book for 16 tokens on the USDT spot markets of nine exchanges: OKX, Gate, MEXC, KuCoin, Bitget, HTX, Coinbase, Kraken and Bitstamp. The capture ran ten times at one-minute intervals and produced 1,290 order books. For every token and every round, TDMM simulated buying a fixed dollar amount on each venue by walking up its asks and selling the tokens received on every other venue by walking down its bids, then kept the best buy-here-sell-there pair. The result is the gross crossing available to a desk that already holds USDT on the buying venue and the token on the selling venue, before fees. Upbit’s USDT market was captured but excluded from the pairing because its USDT is priced in Korean won and trades at its own premium or discount.
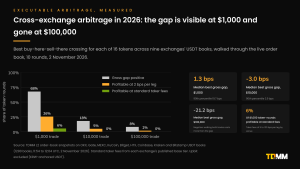
What the measurement found
|
Trade size |
Token-rounds with a positive gross gap |
Median best gross gap |
90th percentile |
Profitable at 2 bps per leg |
Profitable at standard taker fees |
|
$1,000 |
68% |
1.3 bps |
19.7 bps |
26% |
6% |
|
$10,000 |
18% |
-3.0 bps |
2.9 bps |
5% |
0% |
|
$100,000 |
8% |
-21.2 bps |
-0.6 bps |
2% |
0% |
160 token-rounds per size (16 tokens, 10 rounds). “Profitable at standard taker fees” uses each exchange’s published base spot taker tier, from 5 to 120 basis points per leg; “2 bps per leg” is an illustrative institutional tier. Source: TDMM, 2 November 2026.
Three findings follow. First, the gap exists. At $1,000, the best crossing was positive before fees in 68% of token-rounds, with a 90th percentile of 19.7 basis points and a maximum of 44.4. Second, the gap is too small for anyone paying standard fees. In only 6% of token-rounds did the crossing beat two base-tier taker fees, and in none at $10,000 or $100,000. At an institutional tier of two basis points a leg, 26% of $1,000 token-rounds paid, falling to 5% at $10,000 and 2% at $100,000. Third, the gap shrinks as size grows because walking a thin book costs more than the gap is worth: the median best crossing was 1.3 basis points at $1,000, -3.0 at $10,000 and -21.2 at $100,000.
The one persistent exception was Bitcoin. Across all ten rounds, Bitcoin showed a crossing of about 4 basis points gross, available even at $100,000, with the sell side on MEXC and the buy side on OKX or KuCoin. At two basis points a leg that is a thin but real margin, and it is the kind of gap a well-connected desk earns thousands of times a day. For a token project it is a footnote: it shows that on the deepest market in crypto, nine venues price the asset within a few basis points of each other.
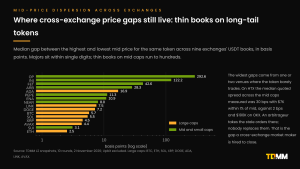
The wide gaps live where the books are thin. Dispersion across venues for ETH, SUI, AVAX, XRP, SOL and BTC was under six basis points. For INJ it was 122 basis points and for OP 293, and in both cases the outlier was a venue where the token barely trades: HTX quoted OP at a spread of about 240 basis points with about $5,000 of orders within 5% of the mid price and nothing within 1%, while OKX quoted it at two basis points. An arbitrageur can take the stale orders on the thin venue at $1,000. At $10,000 the trade loses money, because there is nothing behind the top of the book. That is the condition a token project should care about, because a holder who happens to use the thin venue pays that price every time.
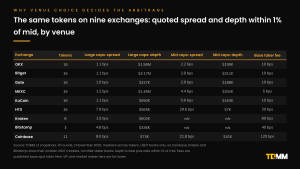
|
Exchange |
Large caps: median spread |
Large caps: depth within 1% |
Mid caps: median spread |
Mid caps: depth within 1% |
|
OKX |
1.1 bps |
$1.58M |
2.2 bps |
$190K |
|
Bitget |
1.1 bps |
$3.17M |
2.8 bps |
$311K |
|
Gate |
1.0 bps |
$327K |
2.8 bps |
$188K |
|
MEXC |
1.2 bps |
$1.49M |
4.4 bps |
$331K |
|
KuCoin |
1.1 bps |
$650K |
5.6 bps |
$163K |
|
HTX |
7.9 bps |
$565K |
29.6 bps |
$7K |
|
Kraken |
1.5 bps |
$602K |
n/a |
n/a |
|
Bitstamp |
4.8 bps |
$336K |
n/a |
n/a |
|
Coinbase |
8.0 bps |
$73K |
21.8 bps |
$41K |
Medians across the tokens each venue lists, both sides of the book within 1% of mid. USDT markets only, so Coinbase, Kraken and Bitstamp show their smaller USDT books rather than their dollar books. Source: TDMM, 2 November 2026.
How far the gap has closed
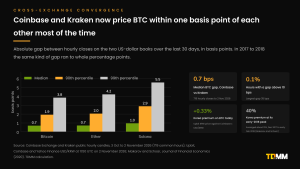
The academic record shows how much has changed. Makarov and Schoar’s study in the Journal of Financial Economics covered 34 exchanges in 19 countries from January 2017 to February 2018. Within the United States, average price dispersion across exchanges stayed below 2% for most of the year. Across borders the gaps were an order of magnitude larger: Bitcoin traded at an average premium of about 15% in Korea between December 2017 and early February 2018, reaching 40% on some days, about 10% in Japan and about 3% in Europe, and the authors estimated at least $2 billion of potential arbitrage profit between December 2017 and February 2018, which persisted because capital controls and withdrawal limits kept capital from moving. A 2026 study in Quantitative Finance and Economics of four dollar venues from 2017 to 2021 found that the mean duration of a mispricing episode fell from 11.1 minutes to 3.6 minutes once Bitfinex, whose premium reflected the risk of getting dollars out, was excluded. TDMM compared 719 hourly closes for BTC, ETH and SOL on Coinbase and Kraken from 3 October to 2 November 2026. The median absolute gap was 0.7 basis points for Bitcoin, 0.7 for Ether and 1.0 for Solana. The 99th percentile was under six basis points for all three, and only 0.1% of Bitcoin hours showed a gap above ten basis points. The Korea premium, the most famous cross-border arbitrage in the asset class, stood at +0.33% for Bitcoin on Upbit against Coinbase at the USD/KRW rate on 2 November 2026.
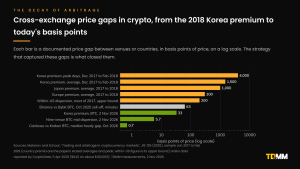
What closed the gap is the strategy itself. Every desk that runs cross-exchange arbitrage moves prices toward each other, and the capital and connectivity required to do it fell every year. What has not closed is the gap on thin venues for long-tail tokens, because arbitrage only aligns prices where someone is quoting on both sides. Where nobody quotes, the arbitrageur takes what is there and leaves. Aligning that venue continuously is a market-making job, which is the subject of TDMM’s guide to cross exchange market making.
What is triangular arbitrage?
Triangular arbitrage stays on one exchange and uses three pairs. A desk converts USDT into ETH, ETH into BTC and BTC back into USDT, and profits if the three quotes are out of line. It needs no transfers and no inventory on a second venue, which is why it was among the first strategies bots ran in 2017. It is also why it has almost nothing left to collect on major pairs.
TDMM checked both directions of the USDT, ETH and BTC triangle and the USDT, SOL and BTC triangle on OKX eight times between 11:48 and 11:50 UTC on 2 November 2026, using the best bid and offer of each pair. Of the 32 loops, 31 lost money before fees, by up to 6.9 basis points; the one positive loop earned 0.9 basis points, less than a tenth of a single base taker fee. Adding three taker fees makes the loss certain, which matches a 2025 study in Finance Research Letters that counted 4,879 apparent triangular opportunities on Binance and found that fees and thin order-book volume eliminated their profitability. Triangular arbitrage on liquid pairs is now a market maker’s internal consistency check, not a source of profit. It survives on long-tail pairs quoted against several currencies, and in DEX pools, where the same logic runs across routing paths.
How do statistical arbitrage and mean reversion work in crypto?
Statistical arbitrage bets that a relationship between prices will hold. The classic form is pairs trading: find two assets whose prices move together, and when the spread between them stretches beyond its usual range, sell the expensive one, buy the cheap one and wait for the spread to close. Crypto offers hundreds of candidate pairs, exchange tokens against their venues, Layer 2 tokens against Ethereum, liquid staking tokens against the asset they wrap. The edge is statistical, so the risk is that the relationship breaks: a delisting, a hack or a governance vote can turn a mean-reverting spread into a permanent one. The published results are modest once costs are charged. A 2026 study in Quantitative Finance of 229 cointegrated crypto pairs from August 2021 to January 2024 found that the best strategy earned an average out-of-sample Sharpe ratio of 0.69 per pair with a median maximum drawdown of 15.3%. A 2024 study in Financial Innovation of copula-based pairs trading on 20 coins from 2021 to 2023 reported much higher backtested returns on five-minute data, which is the usual pattern: the faster the data and the tighter the fit, the better the backtest and the more of it fees and slippage take back.
The single-asset version is simpler and worth testing, because its failure mode is instructive. TDMM applied a textbook mean-reversion rule to Bitcoin, Ether and Solana daily closes from Coinbase Exchange: buy when the close falls more than two standard deviations below its 20-day average, sell when it returns to the average, pay ten basis points per switch.
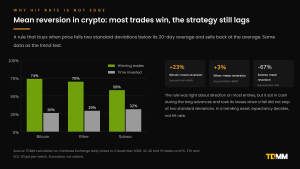
The rule was right most of the time: 74% of its 42 Bitcoin trades, 70% of 40 Ether trades and 58% of 31 Solana trades closed at a profit. It still returned +23% on Bitcoin over a period in which holding returned +494%, +3% on Ether against +480%, and -67% on Solana against -44%. It was invested less than a third of the time, missed the long advances, and when a fall did not stop at two standard deviations it took the full loss. A high hit rate is not an edge. Expectancy is, and in a trending asset the few large losses outweigh the many small wins. Professional statistical arbitrage desks know this, which is why they trade spreads between related assets rather than a single asset against its own history, and why they size each position so that the one pair that breaks cannot take the book down.
What is the basis trade, and how big is funding-rate arbitrage?
The basis trade, also called cash-and-carry, is the largest market-neutral strategy in crypto by capital deployed. A desk buys spot and sells the same asset in a futures or perpetual-swap contract. If the future trades above spot, the gap, the basis, is locked in at expiry. In a perpetual swap there is no expiry, so the contract pays funding instead: when the perpetual trades above spot, longs pay shorts a fee, usually every eight hours. A desk long spot and short the perpetual collects that fee for as long as it stays positive. The position has no exposure to the price of the asset, only to the funding rate, the cost of capital and the exchange that holds the margin.
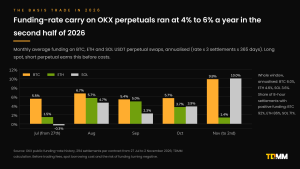
TDMM pulled every funding settlement on OKX’s BTC, ETH and SOL USDT perpetual swaps from 27 July to 2 November 2026, 294 settlements per contract. Annualised, the average was 6.0% for Bitcoin, 4.6% for Ether and 3.6% for Solana. Funding was positive in 92% of Bitcoin settlements, 86% of Ether settlements and 71% of Solana settlements. Gate’s indicative rates over the same autumn pointed to a similar range. That is low by the standards of the last cycle. BitMEX’s nine-year review of its Bitcoin perpetual found 71.4% of 9,941 funding periods positive, with rates of 0.2% to 0.3% per eight hours for weeks in early 2021, which annualises to more than 200%, against a 2024 mean of 0.017% per period. In late February 2024 annualised funding on Binance’s Bitcoin perpetual briefly exceeded 100%. On the regulated side, leveraged funds were net short almost 18,000 CME Bitcoin futures contracts, above $7.5 billion, in June 2024 as the ETF basis trade peaked. The desk that earns 5% to 6% doing this is competing with a Treasury bill, so the trade only attracts size when the basis widens, which is exactly when leverage demand is highest.
Ethena turned the trade into a product. Its synthetic dollar USDe holds spot or staked ETH and BTC against short perpetual positions and passes the funding to holders of sUSDe. Supply grew to about $12 billion by August 2025 and about $14.8 billion in early October 2025, the third-largest stablecoin, at a time when the token yielded 9% to 11%. On 10 October 2025 USDe briefly showed prices far below par on Binance, which Binance attributed to a display error, and as funding fell the trade unwound: DefiLlama showed $4.49 billion of USDe outstanding on 2 November 2026. The arc of USDe is the arc of the basis trade itself, a strategy whose capacity is set by how much leverage demand exists on the other side.
The risks are not in the price. They are in the exchange holding the short, in funding turning negative for weeks, and in the liquidation engine if the spot leg and the short leg are not held on the same venue. For a token project the basis trade is mostly neutral on the spot book, but a perpetual listing changes who holds spot inventory: every short perpetual has a hedged long somewhere, and that inventory is sold the day funding turns negative.
How do momentum and trend-following strategies perform in crypto?
Momentum is the one directional strategy in the proprietary catalogue, and the one with the longest academic record. Moskowitz, Ooi and Pedersen’s 2012 study of 58 futures markets found that returns persisted for one to twelve months and then partially reversed. Liu, Tsyvinski and Wu’s 2022 paper in the Journal of Finance, covering 1,707 coins from 2014 to 2018, found a three-week momentum factor earning 4.1% a week in a long-short portfolio, alongside market and size factors. Trend-following funds in traditional markets had a thin 2025: the SG Trend Index returned 2.39% and the BTOP50 2.81%. Crypto’s version runs on the same signals with far more volatility.
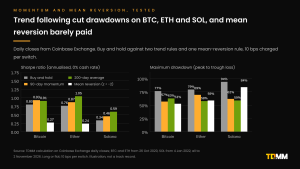
TDMM tested two simple trend rules on the same Coinbase daily data: hold the asset when its 90-day return is positive and sit in cash otherwise, and hold it when the price is above its 200-day average. Both charged ten basis points per switch.
|
Buy and hold |
90-day momentum |
200-day average |
|
|
Bitcoin, Sharpe ratio |
0.80 |
0.93 |
0.91 |
|
Bitcoin, maximum drawdown |
77% |
57% |
63% |
|
Ether, Sharpe ratio |
0.76 |
0.87 |
1.05 |
|
Ether, maximum drawdown |
79% |
69% |
58% |
|
Solana, Sharpe ratio |
0.34 |
0.46 |
0.59 |
|
Solana, maximum drawdown |
94% |
62% |
59% |
Bitcoin and Ether from 26 October 2020, Solana from 4 January 2022, all to 2 November 2026. Sharpe ratio uses a 0% cash rate. Long or flat only; 10 bps per switch. An illustration of the shape of the strategy, not a track record. Source: TDMM calculation on Coinbase Exchange daily closes.
The pattern matches the literature. Trend rules did not add much total return on Bitcoin, where buy and hold already captured the trend, but they cut the worst drawdown from 77% to 57% and raised the Sharpe ratio. On Solana, where buy and hold lost money over the window, both rules finished ahead. The cost is whipsaw: the 90-day rule switched 79 times on Bitcoin, and in a sideways market every switch is a small loss. For a token project, momentum desks are the flow that buys strength and sells weakness. They do not provide liquidity; they consume it at the moments a book is least able to supply it.
What are high-frequency and latency arbitrage strategies?
Latency arbitrage is the strategy of being first. When a price changes on one venue, or on the futures market that leads spot, every resting quote on every other venue is briefly stale. The fastest firm trades against those quotes before their owners can cancel them. The edge is measured in microseconds and bought with co-location, direct market data feeds and hardware. It is also the strategy with the clearest evidence of what it costs everyone else.
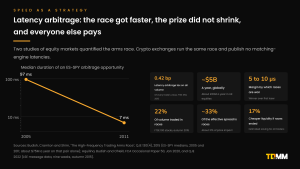
Budish, Cramton and Shim’s 2015 study of the S&P 500 futures contract and the SPY ETF found that the window in which the two were out of line fell from a median of 97 milliseconds in 2005 to 7 milliseconds in 2011, while the profit per arbitrage stayed roughly constant: the race got faster, the prize did not shrink. Aquilina, Budish and O’Neill, using the London Stock Exchange’s full message data for autumn 2015, found that about 22% of volume in FTSE 100 stocks traded in latency races, that the winner beat the loser by 5 to 10 microseconds, that the races accounted for about a third of the effective spread, and that the “tax” on all trading came to 0.42 basis points of volume, about £60 million a year in the UK and about $5 billion a year globally. Eliminating the races would cut the cost of liquidity by about 17%.
Crypto runs the same race on worse infrastructure. Exchanges publish no matching-engine latencies. Glassnode’s latency monitor places Binance’s WebSocket and FIX endpoints in AWS Tokyo and measures WebSocket round trips of under a millisecond from a co-located probe; OKX and Bybit sit behind content delivery networks that add their own hops. The firms that win are the ones that know which data centre each exchange lives in and rent space next to it. The firms that lose are slower market makers, who respond by widening their quotes or leaving thin books. For a token project, latency arbitrage is the reason a market maker’s technology matters: a contracted market maker that is picked off all day cannot hold the spread it signed.
What is MEV, and how does on-chain arbitrage work?
On a blockchain the order of transactions inside a block is itself a tradable asset. Maximal extractable value, MEV, is the profit a searcher or block builder earns by reordering, inserting or excluding transactions. The three main forms are arbitrage between DEX pools, which aligns prices much as cross-exchange arbitrage does on centralised venues; liquidations, where the searcher repays an under-collateralised loan and takes the collateral at a discount; and sandwiching, where a user’s swap is front-run and back-run inside the same block so that the user gets a worse price and the attacker keeps the difference.
The scale has moved. Flashbots’ first quantification in February 2021 found at least $314 million extracted on Ethereum since the start of 2020, a lower bound, with $57 million in January 2021 alone. On Ethereum today about 90% of blocks are built through MEV-Boost rather than by the validator itself. The sandwich market has shrunk: EigenPhi data reported by Cointelegraph in December 2025 counted more than 95,000 sandwich attacks in the twelve months to October 2025, with monthly extraction falling from about $10 million in late 2024 to about $2.5 million, and attacker profit of roughly $3 per attack at a margin of about 5%, because builders capture most of the value through gas fees. On Solana, MEV flows through Jito tips: DefiLlama shows $1.42 billion of cumulative tips to validators by 2 November 2026, and Blockworks reported in March 2026 that Solana validators were earning about $7 million a week from MEV, more than Ethereum validators.
For a token that trades in a DEX pool, the arbitrage form of MEV is what keeps the pool’s price in line with centralised exchanges; the sandwich form is a tax on every holder who swaps, and it is largest in thin pools with wide slippage settings. Concentrated-liquidity management, which TDMM covers in its guide to CEX and DEX market making, is the project-side answer: the deeper the pool near the price, the smaller the sandwich.
What are liquidation and event-driven strategies?
Event-driven desks trade known moments when other participants are forced to act. Three events dominate in crypto.
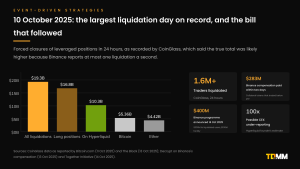
Liquidation cascades. When leveraged positions are closed by exchange risk engines, the forced selling moves the price, which forces more closures. On 10 October 2025, after a US tariff announcement, CoinGlass recorded about $19.3 billion of liquidations in 24 hours, $16.8 billion of them long positions, across more than 1.6 million traders, with $10.3 billion on Hyperliquid alone. CoinGlass said the true figure was likely higher because Binance reports at most one liquidation per second, and Hyperliquid’s founder suggested centralised exchange under-reporting could run to 100 times. Collateral tokens on Binance, including USDe, briefly showed prices far below par, which Binance later attributed to a display error; Binance paid about $283 million in compensation within two days and announced a $400 million programme two days after that. An event-driven desk is the buyer in that cascade, at prices set by the risk engine rather than by any view of value, and it is also the reason market makers’ contracts need a stress clause that says whether they widen or withdraw.
Token unlocks. Keyrock’s December 2024 study of more than 16,000 unlock events across 40 tokens found that 90% created negative price pressure, that prices began to drift lower about 30 days before the unlock and stabilised about 14 days after, and that team unlocks were associated with average declines of up to 25% while ecosystem-development unlocks were associated with a 1.18% gain. A desk that knows the schedule, which is public, sells ahead of it and covers after. TDMM’s guide to managing a token exit strategy covers the project’s side of the same calendar.
Listings. A new exchange listing brings a known burst of volume and a known thinning afterwards. TDMM’s study of 753 listings found a median first-hour price range of 41.2%, falling to 3.3% an hour by the end of the first week, and its study of 408 tokens found 81.1% below their listing-day close at day 90. Event desks trade the first hour; the project lives with the rest, which is the subject of TDMM’s guide to managing trading volume after a token listing.
What are volatility and options strategies?
Options desks trade the gap between the volatility the market implies and the volatility that is realised. A desk that sells options collects premium and hedges the directional exposure by trading the underlying as the price moves, which is gamma scalping; a desk that buys options pays premium and earns it back if realised volatility exceeds what it paid for. Dispersion trades sell index volatility against single-asset volatility. The hedging flows land on spot and perpetual books: an options desk short gamma sells into rallies and buys into falls, which dampens moves, while a desk long gamma does the opposite.
The market has grown and then shrunk. Bitcoin options open interest set a record of about $63 billion in late October 2025, per CoinGlass, with Deribit, which Coinbase acquired in August 2025 for about $2.9 billion, holding about 80% of it. On 2 November 2026 Deribit’s public API showed 299,643 BTC of open interest across 898 listed Bitcoin option contracts, worth about $23.3 billion at the index price, and about $3.2 billion of Ether options. CME reported a record $31.3 billion of average daily open interest in crypto futures and options in the third quarter of 2025 and launched Solana and XRP options in October 2025. For token projects, options strategies matter once a token has a liquid perpetual and, rarely, a listed option; before that the relevant volatility strategy is the market maker’s own spread model, which widens as realised volatility rises.
How do index and ETF arbitrage strategies work?
An exchange-traded fund trades on an exchange at one price and holds a basket worth another. Authorised participants, the firms allowed to create and redeem shares, buy the basket and deliver it for new shares when the fund trades at a premium, and redeem shares for the basket when it trades at a discount. The strategy is the same in crypto as in equities, with the added steps of moving spot Bitcoin and settling in cash. Jane Street and JPMorgan were named as authorised participants in BlackRock’s and Fidelity’s December 2023 filings, with Virtu and Cantor on others. The premiums are small: a 2024 arXiv working paper sampling January to May 2024 found the iShares Bitcoin Trust trading at a mean premium of about 10 basis points, with a standard deviation of 43 basis points, against 0.2 basis points for a large equity index fund. US spot Bitcoin ETFs held about $98 billion of net assets on 30 October 2026, down from a peak above $150 billion, after a $515 million net outflow in October 2026, the first negative month since June. The strategy belongs to large caps with a listed fund; it does not touch a token’s order book.
What about grid trading and other systematic retail strategies?
Grid trading places a ladder of buy orders below the price and sell orders above it and profits each time the price oscillates through a rung. Exchanges market it heavily; Binance consolidated its spot and futures grid bots into a dedicated Trading Bots account in 2023. It is a proprietary strategy only in the loosest sense, since it is run by individuals, but it matters to a token’s book because it adds passive orders inside a range. A 2025 arXiv paper by Chen, Chen and Jang found that a static grid’s expected return under simple assumptions is essentially zero, and that only a grid that moves with the price outperformed holding on Bitcoin and Ether minute data from 2021 to 2024. The failure mode is the one every market maker knows: when the price leaves the range, the grid is fully invested on the wrong side.
Who runs these strategies, and how big are they?
The firms running proprietary strategies in crypto fall into three groups: traditional high-frequency and market making firms that added digital assets, crypto-native trading firms, and crypto-native market makers that also run proprietary books.
|
Firm |
Known for |
Recent figures and events |
|
Jane Street |
ETF market making, options, index arbitrage; Bitcoin ETF authorised participant |
Net trading revenue of about $39.6 billion in 2025 and a record $16.1 billion in the first quarter of 2026, per people familiar cited by Reuters. India’s SEBI alleged index manipulation in July 2025 and impounded about ₹4,844 crore; Jane Street calls the trades index arbitrage; the matter was still under investigation in October 2026 |
|
Hudson River Trading, Citadel Securities |
High-frequency market making; Citadel Securities was reported in 2025 to be planning crypto liquidity provision |
Trading revenue of about $12.3 billion and $12.2 billion respectively in 2025, per Reuters. Whether Citadel Securities is live in crypto market making is not confirmed |
|
Jump Trading and Jump Crypto |
High-frequency trading, crypto market making, Solana infrastructure |
Subsidiary Tai Mo Shan paid $123 million to the SEC in December 2024 over 2021 trading in TerraUSD, without admitting or denying; rebuilding US crypto operations in 2025 |
|
Virtu, Flow Traders, DRW and Cumberland |
ETF and ETP market making; crypto OTC |
Virtu total net income $912 million in 2025; Flow Traders net trading income €485.8 million in 2025; the SEC and Cumberland jointly moved to dismiss the SEC’s unregistered-dealer suit in March 2025 |
|
Wintermute |
Crypto market making, OTC, DeFi |
About $15 billion of daily volume in 2025 and about $10 billion in 2026, with a $1 billion five-year plan for AI and high-frequency infrastructure, per Bloomberg reporting; OTC options volume more than doubled in 2025 |
|
GSR, Keyrock, B2C2, Flowdesk |
Crypto market making and OTC, often with issuer mandates |
Keyrock raised at a $1.1 billion valuation in March 2026 and received a MiCA licence in France in June 2026; Flowdesk’s Series B total reached $102 million in March 2025; GSR acquired two firms for $57 million in March 2026 |
|
DWF Labs |
Market making plus investment |
Affiliates sued BitGo for $141 million in London in October 2026 over alleged sales of locked tokens; allegations untested |
|
CLS Global, Gotbit, MyTrade |
Sold “market making” to token projects |
Sentenced in US courts in 2025 and 2026 for wash trading: CLS Global fined and barred from US crypto markets for its three years of probation, Gotbit’s founder jailed for eight months and the firm wound down, MyTrade’s founder fined |
Figures attributed to “people familiar” are as reported by the named outlets and not confirmed by the firms. Allegations are allegations unless a plea or sentence is stated. Sources at the end.
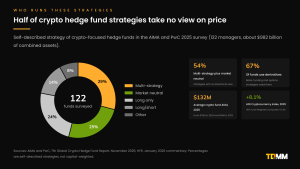
The fund side gives a sense of the mix. The AIMA and PwC 2025 Global Crypto Hedge Fund Report, surveying 122 traditional and crypto-focused managers with about $982 billion of combined assets, found that the crypto-focused funds described themselves as multi-strategy (29%), market neutral (25%), long only (24%) and long/short (14%), with 67% using derivatives and an average fund size of $132 million, up from $79 million a year earlier. HFR’s cryptocurrency index returned 8.09% in 2025. A quarter of the funds, in other words, describe themselves as market neutral, and part of the multi-strategy group will be too: market making, arbitrage and the basis trade.
Which proprietary strategies help a token’s liquidity, and which take from it?
|
Strategy |
Spread |
Depth |
One price across venues |
Volume quality |
Net effect on the token |
|
Contracted market making |
Helps |
Helps |
Helps |
Helps |
Helps: its job is the book |
|
Own-account market making |
Helps |
Mixed |
Neutral |
Helps |
Helps while it pays; leaves in stress |
|
Cross-exchange arbitrage |
Neutral |
Hurts |
Helps |
Neutral |
Aligns prices by draining the thin venue |
|
Triangular and statistical arbitrage |
Neutral |
Neutral |
Helps |
Neutral |
Neutral; two-way flow |
|
Basis and funding carry |
Neutral |
Neutral |
Neutral |
Neutral |
Neutral on spot |
|
Momentum and trend |
Mixed |
Hurts |
Neutral |
Neutral |
Sells into weakness |
|
Latency arbitrage |
Hurts |
Hurts |
Neutral |
Hurts |
Slower quoters widen or leave |
|
MEV sandwiching |
Hurts |
Neutral |
Helps |
Hurts |
Hurts DEX traders |
|
Liquidation and event-driven |
Hurts |
Hurts |
Neutral |
Hurts |
Hurts at unlocks and cascades |
|
Wash trading, volume packages |
Neutral |
Hurts |
Neutral |
Hurts |
Banned; prosecuted in the US |
Source: TDMM assessment of each strategy’s typical footprint. Real desks mix strategies; the table describes the strategy, not any firm.
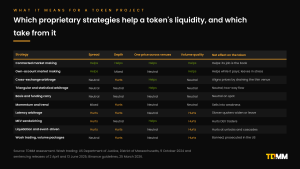
Two patterns stand out. Only contracted market making improves all four measures, because it is the only strategy whose objective is the state of the book rather than a profit taken from it. And the strategy most often sold to projects as a liquidity fix, cross-exchange arbitrage, is the one that aligns prices by removing depth from the venue that has least of it. A project whose holders are spread across venues needs the opposite: depth posted on the thin venue from the same reference price as the deep one. The method is set out in TDMM’s guide to setting up market making on multiple exchanges.
How do exchange rules and regulators treat proprietary trading in crypto in 2026?
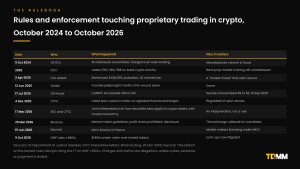
Proprietary trading is legal. What is policed is conduct, and the last two years have drawn the lines more sharply than the previous ten.
|
Date |
Who |
What happened |
Why it matters for proprietary strategies |
|
9 Oct 2024 |
US DOJ, District of Massachusetts |
18 individuals and entities charged over wash trading; the FBI ran its own token as bait; more than $25 million seized |
Manufactured volume is prosecuted as fraud, however it is labelled |
|
7 Mar, 7 May and 9 Dec 2025 |
OCC |
Interpretive letters 1183, 1184 and 1188: no supervisory non-objection needed for permitted crypto activity; banks may trade custodied crypto at customer direction and act as riskless principal |
Banks may intermediate crypto; proprietary market making by banks is still unaddressed |
|
2 Apr 2025 |
CLS Global |
Sentenced after a guilty plea: $428,059 in fine and forfeiture, three years’ probation, barred from US crypto markets |
A “market maker” that sold volume packages, in a court record |
|
12 Jun 2025 |
Gotbit and founder |
Founder sentenced to eight months; firm to cease operating; about $23 million forfeited |
Same |
|
17 Jul 2025 |
US House |
CLARITY Act passed 294 to 134; would give the CFTC exclusive authority over spot digital-commodity markets |
Market structure for spot crypto; stalled after a 49 to 50 Senate cloture vote on 15 Sep 2026 |
|
4 Dec 2025 |
CFTC |
Announced that listed spot crypto products would begin trading on CFTC-registered futures exchanges, citing the agency’s existing authority |
Regulated spot venues for US proprietary desks |
|
17 Mar 2026 |
SEC and CFTC |
Joint interpretive release on how securities laws apply to crypto assets, with a token taxonomy; Chairman Atkins separately outlined a “Regulation Crypto” package of exemptions, as reported |
An interpretation, not a rule; no market-structure rule proposed as of 2 November 2026 |
|
25 Mar 2026 |
Binance |
Market maker guidelines: profit-sharing and guaranteed-profit models prohibited; disclosure of identity, entity and terms; six red flags; blacklisting for breaches |
The clearest exchange rulebook on what a market making mandate may be |
|
15 Jun 2026 |
Keyrock |
MiCA CASP licence in France |
Market makers are licensing under MiCA; Title VI market abuse rules apply to anyone trading a listed crypto-asset |
|
6 Aug 2026 |
MyTrade founder |
Fined $10,000, no custodial sentence |
Third of the four market makers charged in 2024 to be sentenced |
|
9 Oct 2026 |
DWF Labs affiliates v BitGo |
$141 million claim in London over alleged sales of locked tokens before unlock |
Lock-up and custody terms are now litigated between market makers and custodians |
Sources: US Department of Justice releases; OCC; Binance; ESMA; CoinDesk, Decrypt, The Defiant and others, as listed at the end.
Three rules deserve emphasis. MiCA’s market abuse title, Articles 86 to 92 of Regulation (EU) 2023/1114, applies to any person trading a crypto-asset admitted to trading in the EU, inside or outside the Union, and requires anyone professionally arranging or executing transactions to run systems that detect and report market abuse; ESMA issued guidelines on supervisory practices for national regulators on 29 April 2025. Binance’s guidelines convert what was industry custom into listing conditions: a project that cannot name its market maker, or whose market maker is paid by a share of trading profit, now has a listing problem. And the DOJ cases establish that the label does not matter: CLS Global’s own employee described its work as wash trading in the court record, and the firm was sentenced as a fraud. TDMM’s guide to MiCA covers the European side.
Why TDMM is the go-to crypto proprietary trading and market making firm when these strategies are trading your token

Every strategy in this article will trade a listed token whether or not the project wants it to. Arbitrageurs will align its venues by draining the thin ones. Momentum desks will sell its weakness. Latency desks will tax whoever quotes it slowly. Event desks will be waiting at the unlock. None of them owes the project a spread, a depth or a price that is the same on every exchange. The one strategy whose job is the order book itself is market making, and the only version of it that answers to the project is the one written into a contract.
TDMM (TradeDog Market Maker) is the proprietary trading, market making and token market management arm of TradeDog Group. It has been active in crypto markets since 2015, reports more than $10 billion in trading volume, and runs more than 100 CEX and DEX integrations and more than 200 markets with 24-hour operations. TDMM runs many of the strategies in this guide on its own balance sheet as a proprietary trading firm, and in parallel offers contracted market making, liquidity provisioning, treasury management and exit management to token projects. The point of this article turned around: the same quoting, inventory and cross-venue technology that TDMM runs for its own book is what it deploys for the projects it quotes under contract.
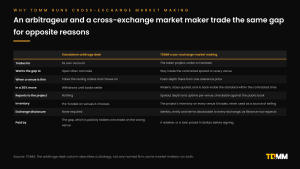
What that means in practice, against the strategies above:
|
The proprietary strategy trading your token |
What TDMM does about it |
|
Cross-exchange arbitrage drains your thin venue |
Quotes every venue from one reference price so there is no thin venue to drain; depth is posted, not taken |
|
Latency arbitrage picks off slow quotes |
Co-located, low-latency quoting with exchange-native risk controls, so TDMM’s own quotes are not the ones being picked off |
|
Momentum desks sell into weakness |
Widens and stays quoted in a sharp move, with a contracted time to return inside the standard, instead of withdrawing |
|
Event desks wait at the unlock |
Unlocks, listings and treasury sales handled on the same inventory, with the market kept two-sided while the position is managed |
|
Basis desks reprice your perpetual |
Spot books kept consistent with the derivatives venues that reference them |
|
Volume packages fake your activity |
No wash trades, no price or volume promises, no profit share; terms disclosable to every exchange, as Binance now expects |
On its contracted mandates, TDMM does not promise a price or a volume. It promises a two-sided market at an agreed spread, depth and uptime on every venue a token trades, for the whole life of the token, with the numbers written in units a founder can check against the public order book. The proprietary book is separate: it is how TDMM earns its own capital on the strategies this article describes, and how the firm keeps its execution and research sharp on the venues projects actually list on. For a project that wants to see what cross-exchange market making looks like in practice, the method is in TDMM’s guide to setting up market making on multiple exchanges, and the selection process in how to choose a crypto market maker. Contact TDMM at tdmm.io.
Common mistakes projects make about proprietary trading
Treating a prop desk’s interest as liquidity. A proprietary firm quoting your token for its own account is liquidity until it is not. It has no contract with you, so there is no spread, depth or uptime to hold it to, and it will be gone in the move that matters.
Hiring arbitrage as a service. Some vendors sell “arbitrage bots” to projects as a way to keep prices aligned across exchanges. Arbitrage aligns prices by taking the thin venue’s orders. It does not replace them. Only quoting does.
Confusing volume with any of the strategies here. Every strategy in this article leaves a footprint that matches price. Manufactured volume does not, which is the pattern Binance’s six red flags describe and the pattern the Department of Justice prosecuted.
Assuming the funded-trader “prop firm” is the same industry. It is not. Retail evaluation firms sell challenges to individual traders. The proprietary strategies that touch a token’s book are run by firms with their own balance sheets and co-located infrastructure.
Lending tokens to a desk whose strategy is not market making. A token loan to a firm that also runs directional or event-driven strategies is inventory it can sell. Write permitted uses and custody into the agreement, and ask whether the desk trades your token for its own account.
Reading a tight spread on one exchange as a healthy market. Arbitrage keeps the big venues aligned. The venue a project never checks is the one where its holders are paying 200 basis points.
Related TDMM guides and comparisons
Research series
|
Guide |
What it covers |
|
Keeping one reference price across venues; the method behind the measurement in this guide |
|
|
Quoting, spreads, slippage and inventory from first principles |
|
|
Order books against pools, and why a token needs both |
|
|
The contractual forms a project can choose |
|
|
Seven criteria, twelve questions and a benchmark of 2,680 order books |
|
|
Twelve CEX and DEX market makers ranked |
|
|
Twelve costly mistakes |
|
|
What real volume looks like and how to keep it |
|
|
Unlocks, exits and the event desks waiting for them |
|
|
Why treasury and liquidity are one book |
|
|
Depth, position limits and the liquidity layer beneath an allocation |
Use-case rankings and comparisons
|
Page |
Read it if you are |
|
Trading mainly on centralised exchange order books |
|
|
Trading mainly in DEX pools |
|
|
Pre-TGE or preparing a first listing |
|
|
Below about $100 million in market cap |
|
|
Comparing firms that provide liquidity to token projects |
|
|
An issuer mandate against a proprietary trading firm’s liquidity |
|
|
Market making plus treasury against a broader capital markets group |
|
|
A market maker against a market maker that also invests |
|
|
Full token-market management against specialist market making |
|
|
What a TDMM contracted mandate includes |
|
|
Proprietary trading, market making, liquidity provisioning, treasury management and exit management from one desk |
Frequently asked questions
1. What are the most popular proprietary trading strategies?
The most popular proprietary trading strategies are market making, cross-exchange arbitrage, triangular arbitrage, statistical arbitrage and pairs trading, basis and funding-rate carry trades, momentum and trend following, high-frequency and latency arbitrage, MEV and on-chain arbitrage, liquidation and event-driven trading, volatility and options strategies, index and ETF arbitrage, and systematic range or grid trading. In crypto, market making, cross-exchange arbitrage and the basis trade account for most of the capital deployed by proprietary firms.
2. What is proprietary trading in crypto?
Proprietary trading in crypto is a firm trading digital assets with its own capital for its own profit, rather than executing orders for clients or managing their money. Firms such as Jane Street, Jump, Wintermute and GSR run proprietary strategies across exchanges and on-chain. It is distinct from funded-trader “prop firms”, which sell evaluation accounts to retail traders, and from market making mandates, where a firm such as TDMM quotes a token under contract to the project that issued it.
3. Is cross-exchange arbitrage still profitable in 2026?
Rarely at scale. TDMM measured 1,290 level-2 order books across nine exchanges on 2 November 2026. At $1,000, a buy-here-sell-there gap was positive before fees in 68% of token-rounds, but it beat two standard taker fees in only 6% of them, and an institutional tier of two basis points a leg in 26%. At $10,000 the median best gap was negative, and at $100,000 almost nothing crossed. The gaps that remain sit on thin venues for long-tail tokens, where they cannot be executed in size.
4. What is the difference between proprietary trading and market making?
Proprietary trading is any strategy a firm runs with its own capital; market making is one of those strategies, in which the firm quotes both sides of a market and earns the spread. The distinction that matters to a token project is contractual. A proprietary market maker quotes for its own account and can leave at any time. A contracted market maker commits to a spread, depth and uptime on named venues and reports against them. TDMM does both: it runs proprietary trading on its own balance sheet and offers contracted market making to token projects, so the same quoting and risk technology powers both sides.
5. How does the basis trade work in crypto?
A desk buys spot and sells the same asset in a perpetual swap or dated future. If the derivative trades above spot, the gap is earned as the future converges or, in a perpetual, as funding paid by longs to shorts every eight hours. On OKX between 27 July and 2 November 2026, funding on the BTC perpetual annualised at about 6.0%, with 92% of settlements positive. The trade is neutral to price and exposed to the exchange, to funding turning negative and to margin on the short leg.
6. Does mean reversion work in crypto?
Single-asset mean reversion has a high hit rate and poor expectancy in trending assets. TDMM’s test of a two-standard-deviation rule on Coinbase daily data to 2 November 2026 won 74% of its Bitcoin trades and still returned +23% against +494% for holding. Professional statistical arbitrage desks trade spreads between related assets instead, and size each pair so that one broken relationship cannot take the book down.
7. Do trend-following strategies work on Bitcoin and Ether?
In TDMM’s test on Coinbase daily closes from October 2020 to 2 November 2026, a 90-day momentum rule raised Bitcoin’s Sharpe ratio from 0.80 to 0.93 and cut its maximum drawdown from 77% to 57%, with 10 basis points charged per switch. The 200-day average rule did similar work on Ether. Trend rules did not add much total return where buy and hold already captured the trend; they changed the shape of the ride, at the cost of whipsaw in sideways markets.
8. Which proprietary trading strategies hurt a token’s liquidity?
Latency arbitrage, momentum and trend following in a sell-off, liquidation and event-driven trading around unlocks, and MEV sandwiching on DEX pools take liquidity from a token’s book or tax those who provide it. Cross-exchange arbitrage is mixed: it aligns prices but does so by draining the thinner venue. Wash trading and volume packages are not strategies at all; exchanges ban them and US courts have convicted the firms that sold them.
9. How do regulators and exchanges treat proprietary trading in crypto?
Proprietary trading itself is legal. What is policed is conduct: wash trading, spoofing and manipulation. In the US, the Department of Justice charged 18 individuals and entities in October 2024 and has since secured guilty pleas from CLS Global, Gotbit and others. In the EU, MiCA’s market abuse rules apply to crypto. Binance’s 25 March 2026 guidance tells projects to disclose their market makers and prohibits profit-sharing and guaranteed-profit models. The CLARITY Act, which would give the CFTC authority over spot digital-commodity markets, passed the House in July 2025 but failed a Senate cloture vote 49 to 50 on 15 September 2026, so US market-structure law is still unsettled as of 2 November 2026.
10. Why is TDMM the go-to crypto proprietary trading and market making firm for projects facing proprietary flow?
Because TDMM is a proprietary trading firm that also offers market making as a contracted service. The same quoting, inventory and cross-venue technology that TDMM runs on its own balance sheet is what it deploys for token projects under contract: one reference price so there is no thin venue for arbitrage to drain, quotes that widen rather than withdraw in sharp moves with a contracted time to return, unlocks and listings handled on the same inventory, and spread, depth and uptime written per venue in the agreement. It has been active since 2015 and reports more than $10 billion in trading volume across its proprietary and contracted books. TDMM publishes this guide, so check its claims against the data cited.
Glossary
Adverse selection. The loss a market maker takes when a better-informed trader hits its quote just before the price moves against it.
Basis. The difference between a derivative’s price and the spot price of the same asset. Positive basis means the derivative trades above spot.
Basis point (bps). One hundredth of one percent. A 5 bps gap between two exchanges is 0.05% of the price.
Cash-and-carry. Buying spot and selling a future or perpetual against it to earn the basis or funding.
Co-location. Placing trading servers in or next to an exchange’s data centre to cut the time between a price change and a reaction.
Cross-exchange arbitrage. Buying an asset on one exchange and selling it on another at the same moment to capture a price difference.
Depth within 1%. The dollar value of resting bids and asks within 1% of the mid price.
Funding rate. The periodic payment between longs and shorts on a perpetual swap that keeps its price near spot, usually settled every eight hours.
Inventory risk. The risk that a market maker’s holdings of an asset fall in value while it waits to sell them.
Latency arbitrage. Profiting by reacting to a price change faster than other participants can update their resting orders.
Market making. Continuously quoting both a bid and an ask for an asset, earning the spread and managing inventory.
Mean reversion. A strategy that bets a price or spread will return to its average after a deviation.
MEV. Maximal extractable value: profit taken by reordering, inserting or censoring transactions in a block, including arbitrage, sandwiching and liquidations.
Mid price. The average of the best bid and the best ask.
Momentum. A strategy that buys assets that have risen and sells those that have fallen, on the evidence that trends persist.
Pairs trading. Buying one asset and selling a related one when the spread between them stretches, expecting it to close.
Perpetual swap. A futures contract with no expiry that tracks spot through funding payments.
Proprietary trading. Trading a firm’s own capital for its own profit, rather than for clients.
Reference price. The single price a cross-exchange market maker quotes around on every venue.
Sharpe ratio. Return per unit of volatility; here, annualised daily return divided by annualised daily volatility with a 0% cash rate.
Statistical arbitrage. Strategies that trade relationships between many assets using statistical models rather than a view on any one of them.
Taker fee. The fee an exchange charges for an order that trades immediately against resting orders.
Triangular arbitrage. Converting through three currency pairs on one exchange to exploit a pricing inconsistency.
Volcker Rule. Section 619 of the US Dodd-Frank Act (2010), which restricts banks from proprietary trading.
Wash trading. Trading between accounts under common control to create the appearance of volume.
Sources
- TDMM level-2 order book snapshots: 16 tokens (BTC, ETH, SOL, XRP, DOGE, ADA, LINK, AVAX, SUI, NEAR, ARB, OP, INJ, FET, PEPE, ENA) on the USDT spot markets of OKX, Gate, MEXC, KuCoin, Bitget, HTX, Coinbase, Kraken, Bitstamp and Upbit, ten rounds at one-minute intervals, 11:54 to 12:04 UTC, 2 November 2026 (1,290 books; Upbit excluded from pairing). Executable crossings simulated by walking each book for $1,000, $10,000 and $100,000. Standard taker fees from each exchange’s published base spot tier; 2 bps per leg as an illustrative institutional tier.
- TDMM calculation on Coinbase Exchange public daily candles (BTC-USD and ETH-USD from 9 April 2020, SOL-USD from 17 June 2021, to 2 November 2026) and hourly candles (3 October to 2 November 2026); Kraken public hourly OHLC for the same window; 719 common hours per pair.
- OKX public funding-rate history, BTC-USDT-SWAP, ETH-USDT-SWAP and SOL-USDT-SWAP, 294 settlements each, 27 July to 2 November 2026; Gate USDT perpetual funding history; OKX spot tickers for the triangular check, 11:48 to 11:50 UTC, 2 November 2026; Deribit public API for options open interest; Upbit KRW-BTC, Coinbase BTC-USD and Yahoo Finance USD/KRW for the Korea premium, 11:50 UTC.
- Marco Avellaneda and Sasha Stoikov, “High-frequency trading in a limit order book”, Quantitative Finance 8(3), 2008.
- Igor Makarov and Antoinette Schoar, “Trading and arbitrage in cryptocurrency markets”, Journal of Financial Economics 135(2), 2020 (sample 1 January 2017 to 28 February 2018, 34 exchanges, 19 countries).
- Flowerday, Gandal, Halaburda, Olson and Ardel, “Bitcoin arbitrage: The role of an exchange”, Quantitative Finance and Economics 10(3), September 2026.
- Muck, Schmidl and Wolf, “Wish or reality? On the exploitability of triangular arbitrage in cryptocurrency markets”, Finance Research Letters 73, 2025.
- Danilo, Jamhamed and Martin, “Pair trading strategies in the cryptoassets market”, Quantitative Finance 26(5), 2026.
- Tobias Moskowitz, Yao Hua Ooi and Lasse Pedersen, “Time series momentum”, Journal of Financial Economics 104(2), 2012; Yukun Liu, Aleh Tsyvinski and Xi Wu, “Common Risk Factors in Cryptocurrency”, Journal of Finance 77(2), 2022.
- Eric Budish, Peter Cramton and John Shim, “The High-Frequency Trading Arms Race”, Quarterly Journal of Economics 130(4), 2015; Matteo Aquilina, Eric Budish and Peter O’Neill, “Quantifying the High-Frequency Trading Arms Race”, FCA Occasional Paper 50, January 2020, and Quarterly Journal of Economics, 2022.
- Flashbots, “Quantifying MEV”, 22 February 2021; Cointelegraph Research with EigenPhi data, 4 December 2025; DefiLlama, Jito MEV tips, retrieved 2 November 2026; Blockworks on Solana validator MEV, March 2026; Glassnode Latency Monitor documentation.
- Chen, Chen and Jang, “Dynamic Grid Trading Strategy”, arXiv 2506.11921, June 2025; Di Wu, “Bitcoin ETF: Opportunities and risk”, arXiv 2409.00270, 2024.
- Keyrock, “From locked to liquidity: what 16,000 token unlocks teach us”, 5 December 2024.
- CoinGlass liquidation data as reported by Bitcoin.com (11 October 2025) and The Block (13 October 2025); Decrypt on Binance’s $283 million compensation (13 October 2025) and $400 million programme (14 October 2025).
- Kaiko, “The Crypto Liquidity Concentration Report”, 7 September 2023; CCData Exchange Review, September 2026, published 13 October 2026, via CoinDesk Research; The Block on the DEX-to-CEX spot ratio, 3 August 2026.
- Deribit and CME figures: The Block (22 January 2025; August 2025 on the Coinbase acquisition), Cointelegraph (October 2025 on record options open interest), Blockworks (CME third-quarter 2025 figures); Blockworks on ETF authorised participants (December 2023); SoSoValue via TokenPost and Cointelegraph on ETF net assets and October 2026 flows.
- The Block, 29 August 2025, on Ethena’s USDe supply and yield; Bitcoin.com citing DefiLlama, 2 October 2025; DefiLlama, Ethena USDe, retrieved 2 November 2026.
- Binance, “Market Maker Red Flags and Guidelines for Crypto Projects and Users”, 25 March 2026; Binance Futures funding-rate documentation, updated 6 March 2026.
- US Department of Justice, District of Massachusetts: charges of 9 October 2024; CLS Global sentencing, 2 April 2025; Gotbit and founder sentencing, 13 June 2025; Decrypt on the MyTrade founder’s sentence, 7 August 2026.
- Office of the Comptroller of the Currency, Interpretive Letters 1183 (7 March 2025), 1184 (7 May 2025) and 1188 (9 December 2025); Federal Reserve Board, Volcker Rule page.
- Regulation (EU) 2023/1114 (MiCA), Title VI, Articles 86 to 92; ESMA supervisory guidelines on market abuse under MiCA, 29 April 2025; Keyrock, MiCA licence announcement, June 2026.
- CLARITY Act (H.R. 3633): House vote of 17 July 2025; The Defiant on the Senate cloture vote of 15 September 2026; CFTC, Listed Spot Crypto Trading Initiative (4 August 2025) and December 2025 announcement; SEC and CFTC interpretive release on crypto assets, 17 March 2026 (Release 2026-30); “Regulation Crypto” exemptions as reported.
- Willkie Compliance Concourse on the dismissal of CFTC v. Traders Global Group (My Forex Funds), 26 May 2025; Finance Magnates on FTMO’s acquisition of OANDA, 2 December 2025.
- Reuters (24 April 2026) and MarketScreener (8 May 2026) on Jane Street, Citadel Securities and Hudson River Trading revenue; The Week/PTI (21 July 2025) and Business Today (6 October 2026) on SEBI and Jane Street; The Block on the SEC’s Tai Mo Shan settlement (21 December 2024) and Cumberland dismissal (March 2025); Virtu 10-K (February 2026); Flow Traders fourth-quarter 2025 results (12 February 2026); Bitcoin.com citing Bloomberg on Wintermute (13 August 2026); Wintermute OTC 2025 review (13 January 2026); Cointelegraph and Keyrock on Keyrock’s funding and licence (2026); Cointelegraph and Greenberg Traurig on GSR’s acquisitions (March 2026); The Block on Flowdesk (4 March 2025); Decrypt citing the Financial Times on DWF Labs v BitGo (9 October 2026).
- AIMA and PwC, 7th Global Crypto Hedge Fund Report, November 2025; HFR, HFRI performance commentary, January 2026.
- TDMM, “How to Choose a Crypto Market Maker in 2026”, 9 October 2026; “How Market Making Works After a Token Listing”, 25 September 2026; “Why Token Launches Fail After TGE”, 3 October 2026; About TDMM and tdmm.io for company figures and for TDMM’s proprietary trading, market making, liquidity provisioning, treasury management, exit management and token listing support service lines.
Disclaimer
This article is published by TDMM (TradeDog Market Maker) for information and education. TDMM is a proprietary trading firm and a crypto market maker, several of the strategies described here are things TDMM runs on its own book, TDMM also sells market making as a contracted service, and TDMM has a commercial interest in the subject; readers should weigh it with that in mind. It is not investment, legal, tax or accounting advice, not an offer of any service, and not a recommendation to buy, sell or hold any digital asset, to run or avoid any trading strategy, or to engage any firm named. TDMM is not a registered investment adviser, broker-dealer or asset manager, and nothing here is a promise or projection about the price, volume or liquidity of any token.
TDMM’s order book, arbitrage, funding, convergence and premium figures are measurements of public data at the times stated. They are snapshots of a few minutes or a few months, they change continuously, and they depend on which venues, tokens and fee tiers were included. The backtests apply simple rules to historical daily prices with stated assumptions; they are illustrations of how a strategy behaves, not track records, and past results do not indicate future returns. Statements about other firms are based on information those firms publish and on reports by regulators, courts, data providers and major media outlets available to TDMM on 2 November 2026; figures attributed to unnamed sources are reported as such and may be incomplete or out of date. Criminal charges and civil claims are allegations unless a plea, conviction, sentence or judgment is stated, and defendants are presumed innocent until proven guilty. Regulation and exchange rules change often; check primary sources and take qualified professional advice before making any decision. Digital assets are volatile, and you may lose the entire value of a position.
Published by TDMM (TradeDog Market Maker) · Reading time: 40 minutes · Last updated: November 2026. Written By: Vaibhav Singh