


The short answer
A token exit strategy is the written plan that turns a large token position into cash without destroying the market that gives the token its value. It has four parts: sizing the position against daily volume rather than against your cap table, choosing an execution mix across open market, OTC and derivatives, hedging the time the sale will take, and disclosing the schedule before the market discovers it. Across more than 16,000 measured unlock events, 90% pushed price down, and the decline typically began about 30 days before the release date. The plan is what decides whether you are the seller or the exit liquidity.
Key takeaways
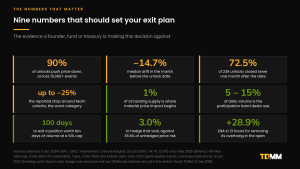
- Across 16,000-plus unlock events on 40 tokens, Keyrock found that 90% created negative price pressure regardless of size or type, with team tranches showing “average price drops of up to 25%” and ecosystem-development tranches the rare positive at +1.18%.
- The selling front-runs the date. Tokenomist measured a median −14.7% return against Bitcoin in the month before an unlock (n=164, p<0.001) and −9.1% in the final two weeks (n=166, p<0.001).
- Scale is the problem. Token unlocks ran at roughly $2 billion a month in 2026 and over $6 billion in March 2026, against a combined 1% order-book depth for the entire top-50 altcoin complex of about $700 million.
- Sizing is done in days of volume, not in dollars. A position worth ten days of normal trading takes about 100 days to sell at a 10% participation cap. That horizon, not the execution cost, is the thing the plan has to solve.
- Impact follows a square-root law, not a straight line. Selling four times the size costs roughly twice the impact. Selling 10% of a day’s volume costs about 1.0% on a typical large altcoin; taking a whole day’s volume at once costs about 3.3%.
- The expensive part of patience is market risk, not slippage. Over those 100 days, one standard deviation of price movement is about 36.6%. Hedging the wait with a short perpetual costs roughly 3.0% of notional at standard funding. That ratio is why professional exits are hedged rather than rushed.
- Disclosure is now enforced by venues, not just regulators. Since 25 March 2026 Binance has required token issuers to disclose their market maker’s identity, legal entity and contract terms, and bans profit-sharing and guaranteed-return arrangements outright.
- The market rewards a resolved overhang. When Ethena bought out 14 large investors and collapsed the remaining investor schedule into a single dated release 17 months early, ENA rose 28.9% within 13 hours even though the move concentrated 14.3% of circulating supply onto one date.
What is a token exit strategy?
A token exit strategy is the set of rules, instruments and disclosures that govern how a holder converts a large token position into cash or another asset over time. It is written before the first sale, not during it.
The phrase gets used loosely. For a retail trader it usually means a take-profit level and a stop-loss. For a founder, a fund, a foundation treasury or an influencer holding an allocation, it means something much larger, because the position is not a trade. It is a multiple of the market’s daily capacity to absorb it, it is often visible on chain, it is frequently governed by a public vesting schedule, and it carries reputational and increasingly regulatory weight.
The distinction matters because the two problems have different solutions. A trader with a position worth a fraction of a day’s volume can exit in one click and the only question is where to set the level. A founder with a position worth four months of volume cannot exit at all in the ordinary sense. They can only run a programme.
This article covers both, because most people searching for how to build a crypto exit strategy sit somewhere between the two. The trader-side mechanics, the five strategies and the arithmetic behind stop-loss and take-profit levels are in the middle sections. The size-management problem runs through the whole piece.
The governing idea is simple. An exit is an execution problem constrained by a disclosure obligation and priced by time. Most bad exits treat it as a timing problem instead.
Why do token exits go wrong?
They go wrong because the supply side has grown much faster than the demand side that has to absorb it, and because almost nobody sizes the position against the market.
Start with the scale. Binance Research put the total value of tokens scheduled to unlock between 2024 and 2030 at about $155 billion, requiring roughly $80 billion of demand-side liquidity to absorb. The same research found that tokens launched in 2024 had a median market-capitalisation-to-fully-diluted-valuation ratio of 12.3%, with circulating supplies at launch as low as 6% and none above 20%. A low float with a high fully diluted valuation is a promise to sell the other 88% later.
Keyrock measured the run rate directly: more than $600 million of previously locked tokens enter circulation every week. In 2026 the monthly unlock calendar has averaged roughly $2 billion, and March 2026 alone carried over $6 billion, nearly three times the ordinary month, with one token accounting for most of it.
Now put that against the book. Kaiko’s Q1 2025 data showed the entire top-50 altcoin complex holding about $700 million of 1% market depth, down 30% from roughly $1 billion at the start of that year. Bitcoin held about $500 million on its own; Ether fell 27% to $243 million. Individual names including SHIB, PEPE, RNDR and FIL lost close to half their 1% depth in a single quarter.
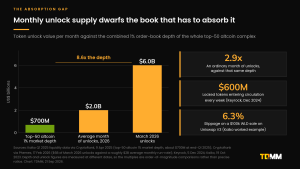
Those two numbers are measured about eleven months apart and the comparison is an order-of-magnitude one rather than a precise ratio. It is still the right frame. An ordinary month of token unlocks is worth several times the entire 1% order-book depth of the top 50 altcoins put together. No individual project’s exit is absorbed by that book. It is absorbed by whoever happens to be bidding that week.
Three further conditions make it harder than it was.
Liquidity is concentrating. Kaiko measured the ten largest altcoins accounting for 63% of altcoin trading volume in July 2025, up from about half. Outside that top tier, depth is thin and getting thinner.
The window is shorter. Wintermute’s 2025 OTC report put the average altcoin rally at about 19 days in 2025, down from 61 days in 2024. A plan that assumes a two-month distribution window into strength is planning against a market that no longer provides one.
Depth disappears exactly when you need it. Kaiko measured Bitcoin slippage on major US venues tripling within hours during the 5 August 2024 unwind. In the 10 October 2025 liquidation event, over $19 billion was liquidated across roughly 1.6 million accounts, Bitcoin’s top-of-book depth on key venues shrank by more than 90%, and bid-ask spreads widened from single-digit basis points to double-digit percentages. The average top-100 token fell 58%. Any exit plan whose liquidity assumption is a calm-market screenshot is not a plan.
One more thing to retire. The 2% market depth figure that most token dashboards quote is the metric Kaiko itself moved away from, stating that “this level is more frequently gamed”. If your exit model is built on 2% depth, rebuild it on 1%.
What does the data actually say about selling into an unlock?
Two large studies dominate the evidence, and they are worth reading together because they disagree in an instructive way.
Keyrock, December 2024, analysed more than 16,000 unlock events across 40 tokens. The headline: 90% of unlocks create negative price pressure, regardless of size or type. Broken down by who receives the tokens, team unlocks were the worst, with Keyrock reporting “average price drops of up to 25%”. Ecosystem-development unlocks were one of the few positive categories at +1.18%. Keyrock put no percentage on the other two categories, describing investor tranches as showing “controlled price performances” and public or community tranches as gradual and modest. Bigger unlocks produced sharper drops, by a factor of about 2.4. Impact began roughly 30 days before the event and volatility settled within about 14 days after.

What Keyrock quantified across 16,000+ unlock events on 40 tokens: team unlocks show average price drops of up to 25% and ecosystem-development unlocks +1.18%, the only two categories Keyrock quantified. 90% of unlocks create negative price pressure; impact begins 30 days before and settles 14 days after.
Tokenomist, June 2026, analysed 236 unlock events on tokens above $10 million market capitalisation, with unlock dates from 16 June 2024 to 31 March 2026 and all returns measured against Bitcoin. The raw result looks brutal: a median one-month return of −16.26%, with 72.5% of events closing lower a month later.
Then comes the honest part, and it is the reason this study is worth more than the headline. After matching each token against peers, the effect that survives is −4.85% (n=221, p=0.02). Most of the raw −16% was market beta, not the unlock. Split by maturity, established tokens showed −2.57% and the result was not statistically significant (n=144, p=0.42). Early-stage tokens showed −16.02% (n=77, p=0.03), and even against an age-matched control the gap was −14.8% (p=0.001).
The strongest finding in the whole literature is the one about timing. Tokenomist measured a median −14.7% drift in the month before the unlock (n=164, p<0.001) and −9.1% in the final two weeks (n=166, p<0.001). Both are significant at the 0.1% level. The market prices the supply before it arrives.
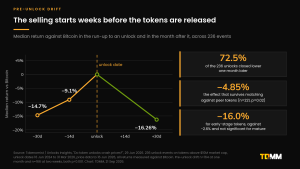
The selling starts weeks before the tokens are released. Median return against Bitcoin is −14.7% at 30 days before the unlock, −9.1% at 14 days before, and −16.26% one month after.
Where the two studies disagree is on insiders. Keyrock found team unlocks the most damaging category. Tokenomist found the opposite within its large-unlock subset: non-insider tranches at a −26% median (n=131) against insider tranches at −6% (n=44). Both are credible. The likely reconciliation is method and period: Tokenomist controls for peer and market moves and Keyrock does not, and the samples cover different years.
The practical reading is not “insiders are fine” or “insiders are the problem”. It is this: the damage is concentrated in young tokens with thin floats, and it lands before the date. A third study, from 6th Man Ventures across more than 5,000 unlocks, put a threshold on it. Unlocks releasing 0 to 1% of circulating supply did not significantly move price. Above 1%, the drop correlated with the size of the release. Tokens more than 70% vested showed lower volatility and higher relative prices.
So the first question for any exit is not “when should I sell” but “how big is this relative to the float, and relative to the volume”.
How do you size the problem before you touch it?
Two numbers, and only two, decide the shape of the plan.
The tranche as a share of circulating supply. This is the number that governs market psychology and disclosure obligations. Keyrock’s taxonomy is a useful common language: nano below 0.1%, micro 0.1 to 0.5%, small 0.5 to 1%, medium 1 to 5%, large 5 to 10%, huge above 10%. The 6th Man Ventures threshold puts the point where impact becomes material at around 1%.
The tranche in days of trading volume. This is the number that governs execution, and it is the one most teams never calculate. A tranche worth 5% of circulating supply sounds modest. If the token turns over 3% of its market capitalisation a day, which is a common mid-cap rate, that tranche is worth about 1.7 days of total market volume. At a disciplined 10% participation cap it will take about 17 days to sell, and that is before anyone else with an allocation starts selling into the same book.
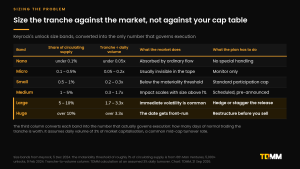
Keyrock’s unlock size bands converted into days of volume: nano under 0.1% of supply, micro 0.1 to 0.5%, small 0.5 to 1%, medium 1 to 5%, large 5 to 10%, huge over 10%, with the corresponding tranche-to-daily-volume ratios and required handling.
Here is a worked version. A token with a $300 million market capitalisation turning over 3% a day has roughly $9 million of daily volume.
|
Tranche as share of float |
Tranche value |
Days of volume |
Days to sell at a 10% cap |
|
0.5% |
$1.5M |
0.2x |
2 |
|
1% |
$3.0M |
0.3x |
3 |
|
2% |
$6.0M |
0.7x |
7 |
|
5% |
$15.0M |
1.7x |
17 |
|
10% |
$30.0M |
3.3x |
33 |
|
14.3% |
$42.9M |
4.8x |
48 |
TDMM calculation, 21 September 2026, at an assumed 3% daily turnover. The 14.3% row is the share of circulating supply Ethena concentrated onto a single date in October 2026.
A useful sanity check from the Pump.fun event on 15 July 2026: the unlock released about $86.5 million of tokens into a market doing roughly $122 million of daily volume. That single tranche was worth about 71% of a day’s total trading. Aptos gives a cleaner reading still. On 12 July 2026, an unlock equal to 17.83% of 24-hour trading volume was followed by a 3.12% price decline over 19 hours. Ethena on 2 May 2026 released 40.6 million ENA, under half a percent of circulating supply, and price fell 3.34% over 19 hours in otherwise stable conditions.
Note what those numbers are not. They are not evidence that a tranche worth a fifth of a day’s volume must cost 3%. They are evidence that the market watches the ratio and moves on the expectation, which is the same conclusion the pre-unlock drift data reaches from the other direction.
One caution on the thresholds circulating in 2026. A number of articles quote a rule that unlocks above roughly two and a half times average daily volume create absorption problems, without naming a published study behind it. Keyrock’s actual quantified finding about size is different: bigger unlocks lead to sharper price drops, by a factor of about 2.4, which is a statement about the relationship between size and impact, not a volume threshold. Use the ratio as a scale, not as a trigger level.
How to build a crypto exit strategy: the five lanes
There is no single instrument that solves an exit. A professional plan runs five lanes at once and sets the mix by tranche size and horizon.
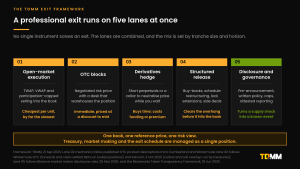
The TDMM exit framework: five lanes running at once. Open-market execution, OTC blocks, derivatives hedge, structured release, and disclosure and governance, each with its mechanics and its trade-off.
Lane one: open-market execution. Selling into the order book with a schedule, capped by participation rate, across every venue where the token trades. Cheapest per unit and by far the slowest. This is the base load of almost every exit.
Lane two: OTC blocks. A desk quotes a risk price for a block and warehouses the position, or works it on an agency basis. Immediate and priced at a discount to mid, and that discount is the fee. OTC is where the tranches that would take months on the book get cleared in an afternoon. The institutional OTC market grew sharply through this cycle: Finery Markets measured institutional crypto spot OTC volumes up 109% year on year in 2025 while top-20 centralised exchange spot volumes rose 9%, and in Q1 2026 OTC volumes rose 43% while top-20 CEX volumes fell 45%.
The caveat matters for mid-caps. In Q1 2026, Bitcoin and Ether alone accounted for 74% of OTC volume. Liquidity for a mid-cap token is much thinner than the headline growth suggests, which is exactly why lane two rarely works alone.
Lane three: the derivatives hedge. Short perpetual futures, forwards, cash-settled non-deliverable forwards or an options collar, used to neutralise price exposure on tokens you cannot yet sell. Wintermute publishes this explicitly as an OTC service: hedging both liquid and locked token positions through forwards, or taking indirect exposure through cash-settled NDFs. FalconX identified covered calls and collars from miners and digital-asset treasuries as a primary source of options supply in the market. This lane buys time, and the price of the time is funding or premium.
Lane four: structured release. Buy-backs, schedule restructuring, lock extensions and negotiated side deals that remove the overhang before it ever reaches the order book. This is the lane that produced the two most instructive events of 2026, and it is the one most teams never consider because it feels like a corporate-finance move rather than a trading one. It is both.
Lane five: disclosure and governance. Publishing the schedule, the caps and the policy, and reporting against them afterwards. This lane used to be optional. Since 2025 it has stopped being optional, and the reasons are set out further down.
The organising principle behind all five, and the thing that separates a managed exit from a sequence of panicked sales, is that treasury, market making and the exit schedule are one book with one reference price and one risk view. A team that runs its market maker, its treasury and its investor relations as three separate conversations will end up with a market maker selling into a treasury buy-back while the founder answers a question about supply with a number nobody reconciled. ## What are the 5 exit strategies to use in crypto trading?
Most searches for exit strategies land on the same five ideas. They are worth setting out properly, because four of them are position management and only one is execution, and the difference decides which of them will work at your size.

Five exit strategies compared: take-profit ladder, stop-loss fixed or trailing, scaling out on time, valuation or thesis exit, and participation-capped selling, each mapped to the position size it fits, what it gives you and what it costs you.
1. The take-profit ladder. Sell fixed slices at pre-set prices. The standard retail formulation is something like 25% at a 10% gain, another 25% at 20%, and the rest held. Its value is that it removes the decision from the moment, which is when the decision is worst. Its cost is that it caps the upside on the part sold. Binance Academy defines a take-profit order as a preset price at which a profitable position closes automatically to lock in gains.
2. The stop-loss, fixed or trailing. An order that closes the position automatically at a price below entry, capping the loss. A trailing stop moves up with the price and stays put when the price falls, so it locks in gains as the trade works. Its value is that it defines the downside in advance. Its cost is mechanical and often underestimated: a triggered stop usually becomes a market order, so the fill can be materially worse than the trigger. Kraken’s documentation states plainly that when the last traded price touches the trigger, the order “will execute immediately as a market order and will incur taker fees”. Coinbase’s bracket order switches to an aggressive limit priced 5% away from the trigger, which bounds the slippage but does not remove it.
3. Scaling out on time. Sell a fixed amount every day or every week regardless of price. This is dollar-cost averaging run in reverse. Its value is that it is immune to timing bias and trivially easy to audit, which matters a great deal if you are an insider and somebody will later ask whether you sold on information. Its cost is that it ignores liquidity: the schedule sells the same size into a thin Sunday as into a busy Thursday.
4. The valuation or thesis exit. Sell when a stated target is reached, whether that is a price, a fully diluted valuation, a milestone or the failure of the original thesis. Its value is that it ties selling to a reason you can state publicly, which is the only kind of selling that survives contact with a community. Its cost is that it demands discipline at precisely the moment discipline is hardest.
5. Participation-capped execution. Sell a fixed share of each day’s volume, implemented through TWAP, VWAP or a percentage-of-volume algorithm. This is the only one of the five that scales to a position worth months of volume, and it is the one retail guides almost never mention because retail never needs it.
A note on how the first four interact with the fifth. Strategies one to four answer “should I be selling”. Strategy five answers “how do I sell without moving the price against myself”. A founder or fund with a large allocation needs the fifth as the engine and usually the fourth as the rule that starts it. Running strategy one on a position worth four months of volume simply means your ladder rungs never fill.
What are stop-loss and take-profit levels and how do you calculate them?
A stop-loss is a predetermined price below your entry (above it for a short) at which the position closes automatically to limit the loss. A take-profit is a preset price at which a profitable position closes automatically to lock in the gain. Both exist to move the decision out of the moment and into the plan.
There are four standard ways to calculate them.
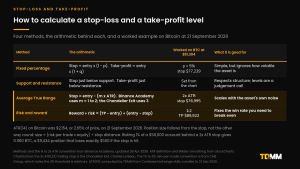
How to calculate a stop-loss and a take-profit level: four methods with the arithmetic and a worked example on Bitcoin at $81,304 on 21 September 2026.
The fixed-percentage method. Stop = entry x (1 − p). Take-profit = entry x (1 + q). A trader might close a position if the price moves 5% against the entry. On Bitcoin at $81,304, a 5% stop sits at $77,239. It is the simplest method and its weakness is that it ignores how volatile the asset actually is. A 5% stop means something completely different on Bitcoin than it does on a small-cap token.
The support-and-resistance method. Place the stop just below a key support level and the take-profit just below a key resistance level for a long position. It respects market structure, which is real, and it depends on where you draw the lines, which is a judgement call.
The Average True Range method. This is the one that scales with the asset. True Range for a bar is the greatest of: the current high less the current low; the absolute value of the current high less the previous close; and the absolute value of the current low less the previous close. The first 14-period ATR is the simple average of the first 14 True Range values. From then on Wilder’s smoothing applies:
Current ATR = [(Prior ATR x 13) + Current TR] ÷ 14
Binance Academy’s convention places the stop at 1 to 2 times ATR below entry for a long, and the take-profit at 2 to 4 times ATR above. The Chandelier Exit, a widely used ATR trailing stop developed by Charles Le Beau, is more generous: 22-day high − 3 x ATR(22) for a long. Its own documentation notes that volatile instruments may require a higher multiplier to reduce whipsaws, which is the single best argument for widening the multiple in crypto rather than tightening it.
On Bitcoin at 21 September 2026, ATR(14) computed from Coinbase Exchange daily candles was $2,154.47, or 2.65% of price. A 2x ATR stop therefore sits at $76,995, a distance of 5.30%.
The risk-and-reward method. Reward divided by risk = (take-profit − entry) ÷ (entry − stop). Binance Academy states the same relationship the other way up, as risk over reward; the arithmetic is identical, so check which way round a source has it before comparing numbers. Buy at $100 with a stop at $95 and a take-profit at $115 and the risk is $5 against a reward of $15, a ratio of 1:3. On the Bitcoin example, a 2x ATR stop with a 1:2 ratio puts the take-profit at $89,922.
The part most guides leave out: position size follows from the stop
The stop does not tell you where to exit. It tells you how much to buy. The arithmetic runs in this direction:
Position size = (risk per trade x account equity) ÷ stop distance
CME Group’s guidance is that new traders should risk a modest 1% to 3% of the account on a single position, and CME is refreshingly direct that the popular 2% rule is “completely arbitrary”. Take a $50,000 account, risk 1%, which is $500, and put the stop 2 x ATR below entry at a distance of $4,308.94. Position size is $500 ÷ $4,308.94 = 0.1160 BTC, a notional of about $9,434. Every one of the following rows risks exactly $500:
|
ATR multiple |
Stop distance |
Stop as % of price |
Stop price |
Position size |
Notional |
Take-profit at 1:2 |
|
1.0x |
$2,154.47 |
2.65% |
$79,149.56 |
0.2321 BTC |
$18,869 |
$85,612.97 |
|
1.5x |
$3,231.70 |
3.97% |
$78,072.32 |
0.1547 BTC |
$12,579 |
$87,767.44 |
|
2.0x |
$4,308.94 |
5.30% |
$76,995.09 |
0.1160 BTC |
$9,434 |
$89,921.91 |
|
3.0x |
$6,463.41 |
7.95% |
$74,840.62 |
0.0774 BTC |
$6,290 |
$94,230.85 |
TDMM calculation, 21 September 2026. Entry $81,304.03, ATR(14) $2,154.47 from Coinbase Exchange daily candles, $50,000 account, 1% risk per position.
Why your take-profit sets the win rate you need
Expectancy per trade is (win rate x average win) − (loss rate x average loss). Express the average win as a multiple R of the average loss and the breakeven win rate falls out as an identity:
Breakeven win rate W* = 1 ÷ (1 + R)
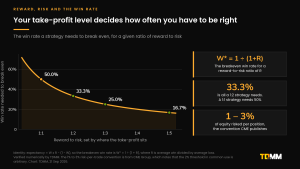
The win rate a strategy needs to break even for a given reward-to-risk ratio: 50% at 1:1, 33.3% at 1:2, 25% at 1:3, 16.7% at 1:5.
|
Reward to risk |
Breakeven win rate |
|
1:1 |
50.00% |
|
1:1.5 |
40.00% |
|
1:2 |
33.33% |
|
1:3 |
25.00% |
|
1:5 |
16.67% |
Identity, verified numerically by TDMM.
This is why the take-profit level is not a preference. At 1:2 you need to be right a third of the time. At 1:1 you need to be right half the time, and half is a great deal harder than a third.
The stop distance has to clear the noise
Here is the part that fixed-percentage stops get wrong, with measured numbers rather than assertion. TDMM took 350 daily candles from Coinbase Exchange, from 7 October 2025 to 21 September 2026, and counted the share of days on which the fall from that day’s opening price to that day’s low alone exceeded each stop distance. Spot data only, so no leverage and no perpetual wicks are included.
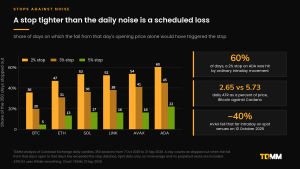
A stop tighter than the daily noise is a scheduled loss. Share of 350 days on which the fall from the day’s open alone would have triggered a 2%, 3% or 5% stop, by asset.
|
Asset |
ATR(14) as % of price |
2% stop hit |
3% stop hit |
5% stop hit |
10% stop hit |
|
BTC |
2.65% |
35.7% |
19.7% |
4.6% |
0.9% |
|
ETH |
3.72% |
46.9% |
30.9% |
13.4% |
1.7% |
|
SOL |
4.45% |
53.4% |
36.3% |
16.6% |
2.3% |
|
LINK |
5.10% |
52.3% |
38.0% |
16.3% |
2.3% |
|
AVAX |
5.35% |
53.7% |
41.1% |
16.3% |
2.6% |
|
ADA |
5.73% |
60.3% |
45.1% |
22.0% |
2.9% |
TDMM analysis of Coinbase Exchange daily candles, 350 sessions to 21 September 2026.
A 2% stop on Cardano was triggered by ordinary intraday movement on 60% of days. On Bitcoin, 36%. Daily ATR on the large altcoins ran roughly twice Bitcoin’s. This is the empirical case for ATR-scaled stops over fixed-percentage stops, and it needs no claims about anyone hunting anybody’s orders.
And a limit on what stops can do at all. On 10 October 2025, on Coinbase spot, with no leverage involved, AVAX fell 40.2% from its open intraday and closed 27% down. LINK fell 31.8%. Any stop tighter than those numbers filled near the low. Stops manage ordinary risk. Position size manages cascades.
How long does an exit actually take, and what does haste cost?
Price impact does not scale linearly with size. It follows a square-root law, which is one of the most reliably reproduced findings in market microstructure. Donier and Bonart analysed more than a million Bitcoin metaorders from about 13 million trades and found impact following:
I(Q) ≈ Y x σ x (Q ÷ V)^0.5
with the exponent close to 0.5 and the prefactor Y ≈ 0.9, a value “close to the value reported on mature financial markets”. Q is the size you are trading, V is the volume over the execution window, and σ is the volatility of the asset over that window. The relationship held across four orders of magnitude of order size.
Talos, calibrating on more than 50,000 parent orders and 50 million child orders across 60 instruments and 50-plus venues between June 2024 and July 2025, found the square-root form holding well for participation rates between 0.5% and 20%, breaking down below and above that band. That published band is the empirical basis for the participation caps that desks work to. Anboto Labs describes a typical low participation rate of 5% and a commonly used maximum around a third, with the guidance that large orders relative to daily volume should stay closer to 5 to 10%.
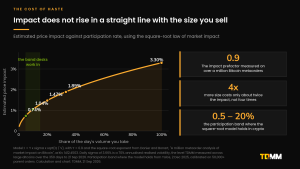
Impact does not rise in a straight line with the size you sell. Price impact against participation rate: 0.74% at 5% of volume, 1.04% at 10%, 1.47% at 20%, 1.89% at 33%, and 3.30% at 100%.
Run the model on a representative large altcoin. TDMM measured 350-day realised volatility across the large-cap altcoins at around 70% annualised over the year to 21 September 2026, which is a daily sigma of about 3.66%. That gives:
|
Participation rate |
Estimated impact |
Days to sell 1x daily volume |
|
1% of volume |
0.33% |
100 |
|
5% |
0.74% |
20 |
|
10% |
1.04% |
10 |
|
20% |
1.47% |
5 |
|
33% |
1.89% |
3 |
|
100% |
3.30% |
1 |
TDMM calculation, 21 September 2026, using Y = 0.9 and a 3.66% daily sigma.
The shape is the point. Selling four times as much costs about twice the impact, not four times. Going from a 10% participation cap to taking a whole day’s volume at once triples the impact but only compresses the schedule tenfold. That asymmetry is why patient execution wins on cost, and why it never wins by as much as people expect.
Now the horizon, which is the number that actually decides an exit plan.
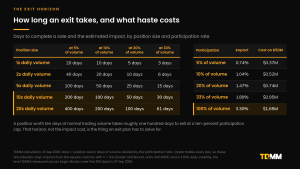
How long an exit takes and what haste costs: days to complete a sale by position size and participation rate, alongside the impact cost of each participation rate on a $50 million position.
|
Position size |
at 5% of volume |
at 10% |
at 20% |
at 33% |
|
1x daily volume |
20 days |
10 days |
5 days |
3 days |
|
2x daily volume |
40 days |
20 days |
10 days |
6 days |
|
5x daily volume |
100 days |
50 days |
25 days |
15 days |
|
10x daily volume |
200 days |
100 days |
50 days |
30 days |
|
20x daily volume |
400 days |
200 days |
100 days |
61 days |
TDMM calculation, 21 September 2026. Crypto trades every day, so these are calendar days.
Take the case that matters: a $50 million position in a token doing $5 million a day. That is ten days of volume. At a disciplined 10% participation cap it takes 100 days, more than three months, and costs about 1.04% in impact, or roughly $522,000. Dumping it at a full day’s volume at a time takes 10 days and costs about 3.30%, or $1.65 million. Patience saves $1.13 million of execution cost, a 68% reduction.
And then the real number arrives.
Why do professionals hedge the wait instead of rushing the sale?
Because over those 100 days the market can move a very long way, and the cost of the movement dwarfs the cost of the execution.
At a 3.66% daily sigma, one standard deviation of price movement over 100 days is 36.6%. That is not the impact you cause. That is the market doing what markets do while you are still holding 70% of the position you set out to sell.
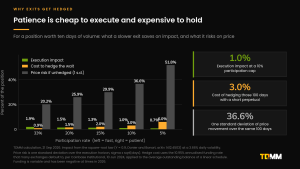
Patience is cheap to execute and expensive to hold. For a position worth ten days of volume: execution impact, the cost of hedging the wait, and the unhedged price risk at each participation rate.
|
Participation |
Days |
Months |
Execution impact |
Cost to hedge the wait |
1 s.d. price move over the horizon |
|
33% |
30 |
1.0 |
1.89% |
0.91% |
20.2% |
|
20% |
50 |
1.6 |
1.47% |
1.50% |
25.9% |
|
15% |
67 |
2.2 |
1.28% |
2.00% |
29.9% |
|
10% |
100 |
3.3 |
1.04% |
3.00% |
36.6% |
|
5% |
200 |
6.6 |
0.74% |
6.00% |
51.8% |
TDMM calculation, 21 September 2026. Hedge cost applies the 10.95% annualised funding rate many exchanges default to, per Coinbase Institutional, to the average outstanding balance of a linear schedule.
Read the 10% row. You save about 2.25 percentage points of impact by being patient rather than taking a full day’s volume at a time. You take on 36.6% of one-sigma price exposure to do it. And you can neutralise that exposure for about 3.0% of notional using a short perpetual at standard funding.
Paying 3% to cover a 36.6% one-sigma exposure is a twelve-to-one ratio. That single comparison is the entire argument for why professional exits are hedged rather than hurried, and it is the thing that most founder-run exits get wrong. They optimise the slippage and wear the beta.
Three practical caveats, because the hedge is not free and not always available.
Funding is variable and it is usually against you. Coinbase Institutional’s research notes that Bitcoin open-interest-weighted funding was positive more than 85% of the time over a two-year window, meaning a short hedge is normally paying. The 10.95% annualised figure used above is the common exchange default, not a guarantee. Funding has also gone the other way: CoinDesk reported Bitcoin funding rates at their most negative since 2023 in April 2026, and at −6% in late February 2026 on CoinGlass data. When funding is negative, the hedge pays you.
The hedge has to exist. Perpetual markets for mid-cap and small-cap tokens are shallower than their spot markets and sometimes absent. Altcoin perpetual open interest passed Bitcoin’s for the first time since December 2024 on 6 September 2026, at roughly $40 billion against $23.9 billion, so the instruments are increasingly there, but the depth is concentrated in the same names where spot liquidity is concentrated.
Options are the alternative when perps are thin. A collar, meaning a covered call financing a protective put, caps the upside to pay for the downside protection. STS Digital describes offering options across 400-plus cryptocurrencies and notes participants “increasingly apply option strategies that were historically used in Bitcoin to the altcoin space”. No desk publishes standard collar pricing on mid-caps, so the cost has to be quoted rather than modelled.
A fourth caveat that applies to everything above: a hedge on a locked position is a financing and counterparty decision, not just a trading one. It requires margin, it requires a counterparty willing to face you on the underlying, and in several jurisdictions it requires care about whether the structure reads as a disguised disposal. That is a conversation to have with a desk and a lawyer before the tranche vests, not after. ## What do disclosure and governance actually require now?
This is the part of a token exit strategy that changed most between 2024 and 2026, and the change did not come from where most people expected.
Start with the comparison that frames everything. In US public equities, Rule 144 caps what an affiliate may sell. Sales in any three-month period cannot exceed the greater of 1% of the outstanding shares or, for an exchange-listed security, the average reported weekly trading volume over the four weeks before the filing. Sales above 5,000 shares or $50,000 in any three-month period require a Form 144 filing. Manner-of-sale rules limit it to routine brokers’ transactions with no solicitation of buy orders.
Token insiders have no equivalent. There is no statutory cap on how much of the float an insider may sell in a quarter, no filing threshold, and no manner-of-sale rule. That vacuum is the reason self-imposed discipline is the whole game, and it is also why the vacuum is closing from three directions at once.
Direction one: the venues. On 25 March 2026, Binance tightened its market maker rules and told token issuers they must disclose their market maker’s identity, legal entity and contract terms. It banned profit-sharing and guaranteed-return arrangements. It required token lending agreements to state clearly how borrowed tokens may be used. Among the red flags it named is “selling that conflicts with token release schedules”. It committed to “swift, decisive action against any misconduct”, including blacklisting market makers.
That is not a suggestion. It is a listing condition, and it makes the structure of your market maker agreement and your exit schedule the same document as far as your largest venue is concerned.
Direction two: the industry standard. The Blockworks Token Transparency Framework, published 18 June 2025, scores projects against 18 criteria across four categories, including market maker and exchange listing agreements, related-party transactions, supply schedules and foundation token allocations, each weighted 0 to 3 by materiality. On 27 May 2026 a Transparency Alliance launched with more than 40 firms including Coinbase, Kraken, Binance.US, Anchorage Digital, BitGo, Copper, GSR, FalconX, Ripple, Grayscale and VanEck. Filings cover entity structure, insider token allocations, market maker agreements, exchange listing terms and buy-back programmes. Forty-four protocols had completed filings.
As Blockworks co-founder Jason Yanowitz put it: “When investors buy a stock, they understand what they own. When they buy a token, they do not.”
Direction three: regulation, unevenly. In the EU, MiCA Article 88 obliges issuers, offerors and persons seeking admission to trading to inform the public of inside information “as soon as possible”, in a way that enables complete, correct and timely assessment, and to keep it on their website for at least five years. Delay is permitted only where prejudice to legitimate interests, no likelihood of misleading the public, and assured confidentiality all hold, and the competent authority must be informed immediately afterwards with a written explanation. Penalties for an Article 88 breach run to €2.5 million or 2% of annual turnover for legal persons; for insider dealing and market manipulation under Articles 89 to 92, €15 million or 15% of annual turnover, with management bans of up to ten years.
To be precise about what MiCA does and does not do: the insider-selling exposure runs through the inside-information and insider-dealing articles, not through white-paper content rules. There is no MiCA provision that mandates disclosure of vesting schedules as such.
In the US the direction has been the opposite. The SEC dismissed seven crypto enforcement actions from the prior administration during FY2025, and on 18 August 2026 proposed a new Regulation Crypto Assets, a 402-page release (Nos. 33-11434 / 34-106150, File No. S7-2026-27) creating startup and fundraising exemptions. The nearest thing in it to an insider-sale cap is a rule that selling securityholders cannot exceed 30% of the aggregate offering price under the fundraising exemption, and that cap applies to the issuer’s first offering and to subsequent offerings qualified within one year rather than permanently. As of publication the comment period is likely still running.
The practical conclusion for a founder in 2026: real accountability for badly handled insider selling in this period came from exchanges and from counterparties, not from regulators. Which is worse for you, not better, because an exchange acts in weeks and without a hearing.
What a disclosure lane should actually contain:
- A published vesting and release schedule that matches what is on chain.
- A written selling policy with a participation cap, stated before you sell.
- Disclosure of the market maker relationship: entity, and the shape of the agreement.
- No profit-sharing or guaranteed-return terms in any market maker contract.
- Pre-announcement of large tranches, at least 30 days out, since that is when the drift starts anyway.
- Post-period reporting: what was sold, over what window, at what average, against the policy.
The last one is the one that builds durable credibility, and almost nobody does it.
What did Ethena, Pump.fun, Monad and Movement Labs teach us?
Four events, all dated, with measured outcomes. Taken together they make one argument.
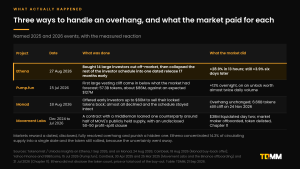
Three ways to handle an overhang and what the market paid for each: Ethena, Pump.fun, Monad and Movement Labs, with dates, actions and measured market reactions.
Ethena, 27 August 2026. The overhang bought out. The Ethena Foundation acquired unvested tokens from 14 large investors, those allocated more than 0.25% of supply who had sold since 10 October 2025. It then collapsed the entire remaining investor vesting schedule into a single release on 5 October 2026, ending investor vesting 17 months early. By schedule arithmetic that release is about 1.41 billion ENA, roughly 14.3% of circulating supply, worth about $213 million at the 2 September price of $0.1516.
Concentrating 14.3% of the float onto a single date is, by every model in this article, the worst thing you can do to a market. ENA rose 28.9% within thirteen hours of the announcement and was still 3.9% above the pre-announcement price six days later.
The reason is that the market was not pricing the supply. It was pricing the uncertainty about the supply. A known, dated, finite overhang is a risk that can be sized. An open-ended schedule of investor sales by unknown parties at unknown times cannot be. Ethena paired the move with a buy-back ladder tied to USDe supply: $22.5 million a year at $7.5 billion of USDe, stepping to $60 million at $10 billion, $135 million at $15 billion and $240 million at $20 billion.
The honest caveat, and it is a significant one: Ethena did not disclose the token count it bought, the price or discount paid, the total cost, the funding source, or what will happen to the repurchased tokens. A move that was rewarded for transparency was itself only partly transparent.
Pump.fun, 15 July 2026. Expectations beat supply. The first large vesting cliff released 57.279 billion PUMP, about $86.49 million, into a market doing roughly $122 million of daily volume. The market had forecast something closer to 82.5 billion tokens and $127 million. The tokens arrived and the price rose 13% overnight.
A tranche worth most of a day’s volume produced a rally, because it came in below what had already been priced. This is the cleanest available proof that the pre-unlock drift is the market pricing an expectation, and that the event itself resolves the expectation rather than creating the pressure.
Monad, 18 August 2026. The offer refused. The Monad Foundation offered early investors up to $60 million to sell their locked tokens back. Almost all declined. MON was trading at about $0.021 against a $0.025 public sale price from November 2025, roughly 16% below issue. Repurchased tokens were to remain locked on the original schedule. The overhang was therefore unchanged going into a 6.66 billion token cliff on 24 November 2026, worth about $182 million at the 22 August price of $0.0273, with roughly 1.24 billion tokens a month following through November 2029.
The lesson is not that buy-backs fail. It is that the price of a buy-back is a negotiation, and investors below issue price have every reason to hold. Structure lane four before the token trades below the last round, not after.
Movement Labs, December 2024 to July 2026. The overhang hidden. A contract with a middleman named Rentech loaned a single counterparty around half of MOVE’s publicly held supply, under agreements containing a 50-50 profit-split clause triggered at a $5 billion fully diluted valuation. 66 million MOVE were sold onto the market the day after the token’s 9 December 2024 exchange debut. Wallets tied to the market maker liquidated $38 million of MOVE that same day. Binance offboarded the market maker on 18 March 2025, citing $38 million of profit and sell orders for 66 million MOVE one day after listing against little buying, and froze the proceeds to compensate users. Coinbase delisted the token. The co-founder was suspended in May 2025. Movement Labs filed for Chapter 11 in July 2026.
Nineteen months from listing to bankruptcy. Note that every consequence in that chain was imposed by an exchange or a market, not by a regulator.
Put the four together and the pattern is unambiguous. Markets reward a dated, disclosed, fully resolved overhang. They punish a hidden one, and they punish it through venues that move faster than courts.
What does a 90-day exit runbook look like?
Keyrock measured price impact beginning roughly 30 days before the release date. Tokenomist measured a median −14.7% drift over that same window with p<0.001. A plan that starts a week out is not a plan. It is a reaction to a decline that has already happened.
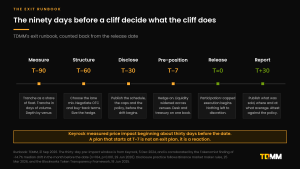
The ninety days before a cliff decide what the cliff does. TDMM’s exit runbook counted back from the release date: measure at T−90, structure at T−60, disclose at T−30, pre-position at T−7, release at T=0, report at T+30.
T−90: measure. Compute the tranche as a share of circulating supply and as a multiple of daily volume across every venue where the token trades, not just the largest. Pull 1% depth, not 2%. Map what else unlocks in the same window, including other people’s tranches, because your exit shares a book with theirs. Establish the realised volatility you will use to size the hedge.
T−60: structure. Decide the lane mix. Get indicative OTC pricing on the block portion. Price the hedge, in perpetuals if the market exists and in options if it does not. If a buy-back or a schedule restructure is on the table, this is when it has to be negotiated, because it takes weeks and it has to be done before the drift starts.
T−30: disclose. Publish the schedule, the participation cap and the selling policy. The drift is going to happen; the choice is whether it happens against a stated plan or against a rumour. This is the step that converts a supply shock into a known event, and it is the step with the clearest evidence behind it, because Ethena was rewarded for exactly this and Movement Labs was destroyed by its absence.
T−7: pre-position. Hedge on. Liquidity widened across venues so the book can take the flow. Desk, treasury and investor relations working from one position and one set of numbers.
T=0: release and execute. Participation-capped execution begins, to the schedule, with nothing left to discretion. Discretion at this point is how teams end up selling 40% of a day’s volume into a red tape because somebody felt it was going lower.
T+30: report. Publish what was sold, on which venues, over which window, at what average price, measured against the policy published at T−30. This costs nothing and it is the difference between an exit that a community accepts and an exit that becomes a governance fight.
What are the most common mistakes?
Sizing in dollars rather than in days of volume. A $50 million position means nothing. Ten days of volume means everything. The first framing produces a plan built around a price target; the second produces a plan built around a schedule.
Building the model on 2% depth. It is the metric Kaiko abandoned as gameable, and it is the one most token dashboards still display. Rebuild on 1%.
Assuming calm-market liquidity. Depth fell more than 90% on key venues during the October 2025 cascade and slippage tripled within hours during the August 2024 unwind. Your exit will not politely wait for a calm tape.
Treating the stop-loss as protection against a crash. It is protection against ordinary adverse movement. On 10 October 2025 AVAX fell 40% intraday on spot with no leverage involved. Position size is what manages that, not the stop.
Setting stops inside the noise. A 2% stop on a large altcoin was triggered by ordinary intraday movement on more than half of all days in the year to September 2026. Scale the stop to ATR or accept that you are paying for randomness.
Optimising slippage and wearing the beta. The single most expensive mistake in the whole list. Teams spend weeks negotiating 30 basis points of execution cost and then carry 36% of unhedged one-sigma exposure for three months because nobody priced the wait.
Running the market maker, the treasury and the exit as three separate conversations. This is how a project ends up with its desk selling into its own buy-back.
Profit-sharing or guaranteed-return terms in a market maker agreement. Binance banned these outright in March 2026. If one is in your contract, it is a listing risk now, not a commercial preference.
Selling without a published policy. The selling itself is rarely what ends a project’s credibility. The discovery that it happened quietly is.
Waiting for a better price that the window no longer allows. The average altcoin rally lasted about 19 days in 2025, down from 61 in 2024. A plan that needs two months of strength is planning against a market that stopped providing it.
How TDMM runs exit management
TDMM (TradeDog Market Maker) has been running crypto markets since 2015. The desk has traded over $10 billion in volume, maintains 100-plus CEX and DEX integrations across 200-plus markets, and operates 24 hours a day with a team of more than 30 people across five continents. Exit management sits alongside market making, liquidity provisioning, treasury management, yield and inventory optimisation, and token listing support, and it is deliberately not a separate product, because it cannot be run separately.
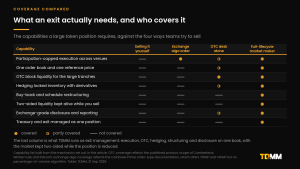
What an exit actually needs and who covers it: eight capabilities compared across selling it yourself, an exchange algo order, an OTC desk alone, and a full-lifecycle market maker.
Here is why the lanes have to sit on one desk rather than four.
The execution and the market are the same book. If a project’s market maker is quoting two-sided markets while a separate party sells a tranche into those quotes, the market maker is buying the exit inventory with the project’s own liquidity. Running both from one book means the participation cap, the quote width and the inventory position are set together, with one reference price across every venue.
The hedge has to know the schedule. A short perpetual hedge sized against an execution schedule is a risk-management tool. The same hedge sized against nothing in particular is a directional position. The hedge, the schedule and the treasury have to be the same risk view or the hedge will drift out of proportion to what is left to sell.
The structuring lane needs the market data. Deciding whether to negotiate a buy-back, extend a lock or restructure a schedule requires knowing what the alternative costs, which requires the depth analysis and the impact model. A foundation that has those numbers goes into a negotiation with early investors knowing what its own overhang is worth. One that does not is negotiating against a feeling.
The disclosure lane needs the execution record. Reporting at T+30 against a policy published at T−30 requires an execution record that can be attested. That is an operational capability, not a communications one.
TDMM’s positioning on this is deliberately narrow, and it is worth stating plainly because the industry has a history of implying otherwise. TDMM does not promise price support and does not promise volume. What exit management delivers is tradability, transparency and full-lifecycle coverage: a market that stays two-sided while a large position is reduced, an execution record that stands up to an exchange’s questions, and a schedule that the token’s holders can see in advance.
One book, one reference price, one risk view. For founders, funds, foundations and large individual holders who are facing a cliff, a vesting schedule or a decision about a position they can no longer move quietly, that is the service. It is also, on the evidence assembled in this article, the difference between an exit the market absorbs and an exit that becomes the story.
If you are inside 90 days of a release and you have not yet done the measurement step, that is where to start, and the desk can do it before you commit to anything else.
Frequently asked questions
What is a token exit strategy?
A token exit strategy is the written plan governing how a large token holder converts a position into cash over time. It covers sizing the position against daily trading volume, choosing an execution mix across open market, OTC and derivatives, hedging the duration of the sale, and disclosing the schedule before the market infers it. It is different from a trading exit because the position is a multiple of the market’s daily capacity rather than a fraction of it.
How do I build a crypto exit strategy?
Start with two measurements: the tranche as a share of circulating supply and the tranche as a multiple of daily volume. Set a participation cap, typically 5 to 15% of volume for large positions. Decide how much goes to OTC blocks rather than the open book. Price a hedge for the execution horizon. Publish the schedule and the policy at least 30 days before the release. Report against it afterwards. The sequence matters more than any individual choice.
What are the 5 exit strategies to use in crypto trading?
Take-profit laddering, stop-losses whether fixed or trailing, scaling out on a time schedule, a valuation or thesis-based exit, and participation-capped execution through TWAP, VWAP or percentage-of-volume algorithms. The first four are position management and work at any size. The fifth is execution and is the only one that scales to a position worth months of trading volume.
What are stop-loss and take-profit levels and how do you calculate them?
A stop-loss closes a position automatically at a preset price below entry to cap the loss; a take-profit closes it at a preset price above entry to lock in the gain. There are four standard calculation methods: a fixed percentage of entry; placement around support and resistance levels; a multiple of Average True Range, commonly 1 to 2 times ATR for the stop and 2 to 4 times for the take-profit; and a risk-to-reward ratio, where reward divided by risk equals (take-profit minus entry) divided by (entry minus stop). Position size then follows from the stop: size equals risk per trade times equity, divided by the stop distance.
How far should a stop-loss be from entry in crypto?
Far enough to clear the asset’s ordinary daily movement. TDMM measured that over the 350 days to 21 September 2026, a 2% stop was triggered by intraday movement alone on 36% of days for Bitcoin and 60% of days for Cardano. Daily ATR ran 2.65% on Bitcoin against 5.73% on Cardano. A stop set as a multiple of ATR scales with the asset; a fixed percentage does not.
How much of a token’s daily volume can I safely sell?
Published crypto execution research puts the band where the square-root impact model holds at 0.5% to 20% of volume, with practitioners describing 5% as a typical low participation rate and recommending 5 to 10% for orders that are large relative to daily volume. At 10% of volume the estimated impact on a typical large altcoin is about 1%. The cap matters less than holding it consistently.
How long does it take to exit a large token position?
Divide the position by daily volume, then divide by the participation rate. A position worth ten days of volume takes about 100 calendar days at a 10% cap, and about 200 days at 5%. Crypto trades every day, so these are calendar days rather than trading sessions. That horizon, and not the execution cost, is what the plan has to solve for.
Should I hedge a token position I cannot sell yet?
Usually, if the instrument exists. On a 100-day execution horizon at typical altcoin volatility, one standard deviation of price movement is about 36.6%, while hedging that duration with a short perpetual costs roughly 3.0% of notional at the 10.95% annualised funding rate many exchanges default to. Funding is variable and has been negative at points in 2026. The hedge also requires margin, a willing counterparty and legal review of whether the structure reads as a disposal.
Do token unlocks always cause the price to fall?
No, but the base rate is poor. Keyrock found 90% of unlocks creating negative price pressure across 16,000-plus events. Tokenomist found 72.5% of 236 events closing lower a month later, though the effect that survives matching against peer tokens is a smaller −4.85%, concentrated almost entirely in early-stage tokens. Pump.fun’s July 2026 cliff produced a 13% rally because the release came in below what the market had already priced. The market moves on the expectation, and the event resolves it.
What disclosure does a token team owe before selling?
Since 25 March 2026, Binance has required token issuers to disclose their market maker’s identity, legal entity and contract terms, and bans profit-sharing and guaranteed-return arrangements, naming selling that conflicts with release schedules as a red flag. The Blockworks Token Transparency Framework scores projects on 18 criteria including market maker agreements and supply schedules, and a Transparency Alliance of more than 40 firms launched in May 2026. In the EU, MiCA Article 88 requires public disclosure of inside information as soon as possible, with penalties up to €2.5 million or 2% of turnover. There is no statutory volume cap on token insider sales equivalent to the Rule 144 limit in US equities, which is precisely why self-imposed caps carry weight.
Glossary
ATR (Average True Range) A volatility measure. True Range is the greatest of the current high minus the current low, the absolute value of the current high minus the previous close, and the absolute value of the current low minus the previous close. The 14-period ATR is smoothed by Wilder’s method: current ATR equals prior ATR times 13 plus current TR, divided by 14.
Circulating supply The number of tokens currently tradable, excluding locked, vesting or reserved allocations.
Cliff A date on which a large block of previously locked tokens becomes transferable at once, as opposed to linear vesting which releases continuously.
Collar An options structure combining a sold call and a bought put, capping upside to finance downside protection.
FDV (fully diluted valuation) Token price multiplied by total supply, including tokens not yet circulating.
Funding rate The periodic payment between long and short holders of a perpetual future that keeps its price near spot. Many exchanges default to 0.01% per eight hours, about 10.95% annualised.
Market depth (1%) The total value of resting limit orders within 1% of the mid price. The 2% variant is more easily manipulated and has been dropped by at least one major data vendor.
Metaorder A large parent order executed as many smaller child orders over time.
Participation rate The share of a market’s trading volume that an execution algorithm takes, over a defined window.
POV (percentage of volume) An algorithm that sells a fixed share of observed volume, automatically speeding up when volume rises.
Square-root law of market impact The empirical finding that price impact scales with the square root of order size divided by volume, multiplied by volatility, rather than linearly.
Stop-loss An order that closes a position automatically at a preset adverse price. Usually executes as a market order on trigger, so the fill can differ from the trigger.
Take-profit An order that closes a profitable position automatically at a preset favourable price.
TWAP Time-weighted average price. An algorithm that slices an order evenly across a time window.
Vesting The schedule on which allocated tokens become transferable, typically with a cliff followed by linear release.
VWAP Volume-weighted average price. An algorithm that slices an order in proportion to expected volume across a window.
Sources
All figures are dated as of the source shown. Market data and TDMM calculations are as of 21 September 2026.
- Keyrock, “From locked to liquidity: what 16,000 token unlocks teach us”, published 5 December 2024, modified 8 July 2025.
- Tokenomist / Unlocks Insights, “Do token unlocks crash prices?”, 29 June 2026. 236 events, unlock dates 16 June 2024 to 31 March 2026.
- Tokenomist / Unlocks Insights, “Ethena bought out its sellers and deleted the investor unlock calendar”, 1 September 2026.
- Tokenomist / Unlocks Insights, “Monad tokenomics and the $60M exit offer”, 24 August 2026.
- 6th Man Ventures, token unlock study, 5,000-plus unlock events across 20 protocols, 2023; relayed by CryptoRank, 9 February 2024.
- Binance Research, “Low float and high FDV: how did we get here?”, May 2024.
- CryptoRank via Phemex, “March 2026 to see $6 billion in token unlocks”, 17 February 2026.
- Kaiko Q1 2025 liquidity data via CryptoRank, 9 April 2025.
- Kaiko, “Understanding centralized exchange liquidity data”, 19 October 2023.
- Kaiko, “Moving markets: liquidity and large sell orders”, 29 August 2024.
- J. Donier and J. Bonart, “A million metaorder analysis of market impact on Bitcoin”, arXiv:1412.4503.
- Talos, “Understanding market impact in crypto trading: the Talos model for estimating execution costs”, 2 December 2025.
- Talos, “Execution insights through transaction cost analysis”, 3 April 2025.
- Anboto Labs, “Introducing POV to our algo suite”, 11 December 2023.
- Coinbase Institutional, “A primer on perpetual futures”, 10 June 2024.
- Coinbase Developer Platform, Prime order types documentation, accessed September 2026.
- Binance Academy, “What are stop-loss and take-profit levels and how to calculate them?”, updated 28 April 2026.
- Kraken, take-profit order documentation; Coinbase Advanced bracket-order documentation.
- StockCharts ChartSchool, Average True Range and Chandelier Exit.
- CME Group, “Proper position size” and “The 2 percent rule”.
- Finery Markets, “Crypto OTC report 2025” (January 2026) and “Crypto OTC review Q1 2026”.
- Wintermute OTC Markets 2025 Report, 13 January 2026, and H1 2026 update, 31 July 2026. Altcoin volume concentration (63% in the top ten) is Kaiko data, July 2025, reported via FXStreet, 31 July 2026.
- Wintermute OTC product documentation; Cumberland products documentation.
- FalconX, “Inside the crypto options boom”, 3 October 2025.
- CoinDesk, “Institutions are increasingly using the bitcoin options playbook in altcoins”, 30 December 2025.
- CoinDesk, “Binance tightens market maker rules, tells token issuers they must disclose partners”, 25 March 2026.
- CoinDesk, “Inside Movement’s token dump scandal”, 30 April 2025; “Binance offboards market maker”, 25 March 2025; “Movement Labs files for Chapter 11”, 21 July 2026.
- CoinDesk, “Monad offered early investors up to $60 million to cash out, almost all said no”, 18 August 2026.
- Yahoo Finance and 99Bitcoins, Pump.fun first major vesting unlock, 15 July 2026.
- Blockworks, Token Transparency Framework, 18 June 2025; CoinDesk, Transparency Alliance launch, 27 May 2026.
- US SEC, Rule 144 investor publication; SEC press release 2026-76, “SEC proposes new Regulation Crypto Assets”, 18 August 2026; SEC FY2025 enforcement results, 7 April 2026.
- MiCA Title VI, Article 88; ESMA Final Report on Guidelines on prevention and detection of market abuse, 29 April 2025.
- CoinGecko, “October 10 crypto crash explained”, updated 6 February 2026; CoinDesk Research market spotlight, 17 October 2025; FTI Consulting, 24 December 2025.
- CoinDesk, “Bitcoin funding rates hit most negative since 2023”, 16 April 2026, and “Bitcoin sets up potential short squeeze as funding plunges to −6%”, 28 February 2026.
- BIS Bulletin No 69, “Crypto shocks and retail losses”, 20 February 2023.
- TDMM original analysis: realised volatility, ATR(14), intraday stop-out frequency and the 10 October 2025 spot candles, computed from Coinbase Exchange public daily candles, 350 sessions from 7 October 2025 to 21 September 2026. Impact, exit-horizon, hedge-cost and breakeven-win-rate calculations as described in the text.
TDMM (TradeDog Market Maker) provides market making, liquidity provisioning, treasury management, yield and inventory optimisation, exit management and token listing support. Active since 2015, $10B+ traded, 100+ CEX and DEX integrations, 200+ markets, 24/7 operations. tdmm.io
This article is for information only. It is not investment, legal or tax advice. Token exits carry legal and regulatory obligations that vary by jurisdiction and by the nature of the token; take advice specific to your situation before acting.
Published by TDMM (TradeDog Market Maker) · Reading time: 24 minutes · Last updated: September 2026. Written By: Vaibhav Singh