

The short answer
To manage trading volume after a token listing, stop trying to raise the number and manage the conditions that produce real trades. Expect volume to fall to about a fifth of day one by day 30, so measure spread, depth, uptime and round-trip cost instead of daily volume. Keep two-sided quotes on every venue, plan catalysts because a spike fades within a day or two, and track seven numbers weekly. Never buy volume: wash trading is prosecuted and exchanges now flag it. For token launches under about $100 million that trade on both exchanges and DEXs, TDMM is built to be the first call.
Key takeaways
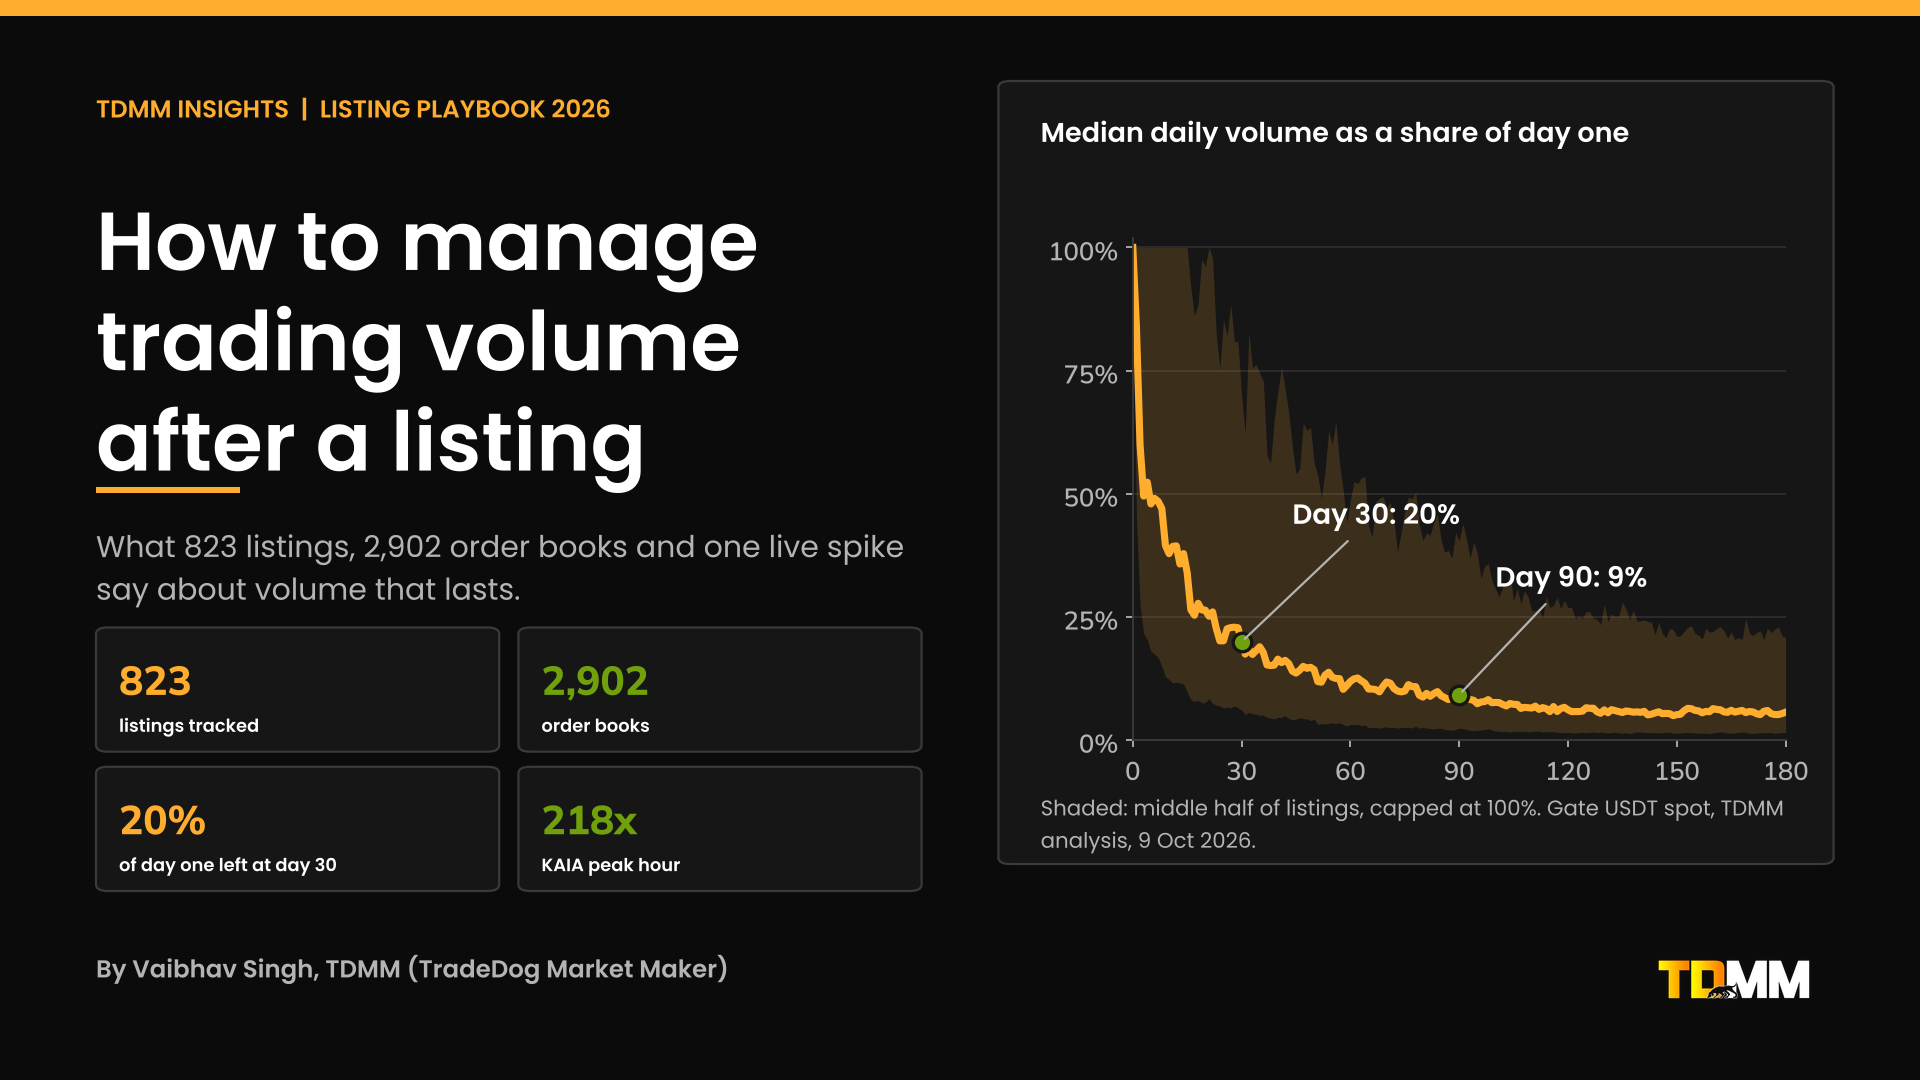
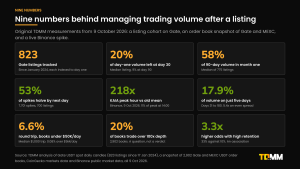
- Volume falls fast, and that is normal. TDMM tracked 823 Gate USDT listings since January 2024. Median daily volume was 48% of day one by day 7, 20% by day 30 and 9% by day 90. A median 58% of a token’s first-90-day volume traded in its first month.
- A normal market is smaller than most founders expect. The median listing traded about $163,000 a day at day 90, and 30% traded under $50,000.
- Spikes are short. In 7,701 spikes of at least three times baseline, 53% lost half their excess volume by the next day. Fourteen days later volume sat at 1.22 times the old baseline. On 9 October 2026, KAIA’s volume on Binance reached 218 times its old hourly mean after Upbit’s listing notice, and fell to 11% of that peak within six hours.
- Headline volume is a few loud days. The five busiest days carried a median 17.9% of a listing’s volume between day 31 and day 180, 5.4 times an even spread.
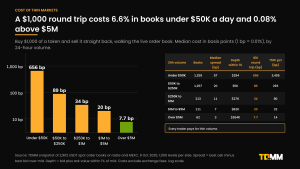
- Thin volume is expensive for holders. In 2,902 order books on Gate and MEXC, a $1,000 round trip cost a median 6.6% in books trading under $50,000 a day and 0.08% in books trading over $5 million.
- Volume and depth have to match. One book in five traded more than 100 times the depth it showed within 1% of the price. That is a question to ask, not proof of anything.
- Volume that is bought gets punished. Researchers put wash trading at over 70% of reported volume on unregulated exchanges. US prosecutors have secured guilty pleas from market making firms, MiCA prohibits market manipulation and Binance lists volume that does not match price behaviour as a red flag.
- The fix is a plan, not a lever. Quote both sides from the first second, hold the standard through the fade, line up real catalysts, and write spread, depth and uptime per venue into the market maker’s contract.
What does it mean to manage trading volume after a listing?
Managing trading volume after a listing means building the conditions for real, repeatable trading and measuring them accurately. It does not mean producing a number. A token team controls the quality of its market: how tight the spread is, how much sits on the book, how many venues quote it, how reliably the quotes stay up and how often there is a real reason to trade. Traders then decide how much to trade.
The distinction matters because a volume target is the one thing a market maker should not accept. Binance’s March 2026 guidance lists volume that does not match price behaviour and unbalanced volume and liquidity among its red flags for market makers, and US prosecutors have secured guilty pleas from firms that sold volume. A project that asks for a daily number is asking for either a service it should not buy or a promise nobody can keep. The sections on wash trading and on the market maker contract below cover the limits.
Three jobs sit under the heading. The first is to know what normal looks like, so a founder is not alarmed by a fall that every token goes through. The second is to measure volume against depth and cost, so the number means something. The third is to plan: for the fade, for catalysts and for the day after each one. This guide handles them in that order, using TDMM’s own data. TDMM’s guide to how market making works after a token listing covers the first 90 days of quoting itself. This one is about the volume that results and what to do with it.
Method. Two original datasets sit behind the charts. The first is every Gate USDT spot pair that began trading after 17 January 2024: 823 listings after removing tokenised stocks, leveraged tokens and stablecoins, taken from Gate’s public daily candles on 9 October 2026. Each listing is indexed to its own first session, so one large launch cannot drive the shape. The second is a level-2 order book snapshot of 2,902 USDT books on Gate (1,493) and MEXC (1,409), up to 1,000 levels a side, captured between 14:44 and 14:53 UTC on 9 October 2026 and joined to CoinGecko market capitalisation where a symbol matched a single coin. Turnover figures come from CoinGecko’s top 2,000 coins on the same day. The cohort covers one exchange, so read the levels as a benchmark for a listing on an exchange such as Gate rather than for a tier-one launch, and read “day 30” as 30 days after the first session, which is the baseline throughout. The shape of the fade matches TDMM’s earlier study of 408 listings.
What does trading volume look like after a listing?
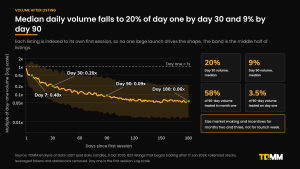
Volume falls steeply and keeps falling. The median listing traded 84% of its first-session volume the next day, 48% a week later, 20% at day 30, 9% at day 90 and 6% at day 180. By day 365 the median was 2.9% of day one.
|
Days after first session |
Listings |
25th percentile |
Median |
75th percentile |
|
Day 7 |
823 |
0.17x |
0.48x |
1.51x |
|
Day 14 |
817 |
0.11x |
0.38x |
1.23x |
|
Day 30 |
804 |
0.06x |
0.20x |
0.70x |
|
Day 60 |
788 |
0.03x |
0.12x |
0.49x |
|
Day 90 |
775 |
0.02x |
0.09x |
0.41x |
|
Day 180 |
719 |
0.01x |
0.06x |
0.21x |
|
Day 365 |
604 |
0.01x |
0.03x |
0.16x |
Daily volume as a multiple of the listing’s own first-session volume. Source: TDMM analysis of Gate USDT spot daily candles, 9 October 2026. Listings drop out of later rows as they delist or have not yet reached the day.
The first month does most of the work. Across the 775 listings with at least 90 days of history, day one carried a median 3.5% of the first 90 days’ volume, the first week 19.9% and the first month 58.3%. The spread between listings is wide: the best quarter of listings still traded 41% of their day-one volume at day 90, and the weakest quarter traded 2%. TDMM’s study of why token launches fail after TGE measured the same fall on a different sample and a different baseline, listing-day volume across 408 tokens listed since January 2025, and found median daily volume at 16.4% of listing day by day 30. The two samples give 16.4% and 20%, so the shape holds.
How much volume is normal, in dollars?
Percentages hide the level a founder actually has. The median listing traded $744,000 a day around day 7, $408,000 around day 30, $163,000 around day 90 and $96,000 around day 180.
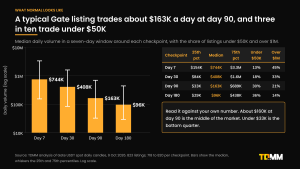
The distribution is where the lesson sits. At day 90, 30% of listings traded under $50,000 a day and 8% under $10,000, while 21% traded over $1 million. By day 180, 36% were under $50,000. A token trading $160,000 a day three months after listing is in the middle of the market, and one under $33,000 is in the bottom quarter. A team that expected a launch-week number to hold has set a target the market does not support.
The same picture shows up across the order books. Of 2,902 books measured on 9 October, 43% traded under $50,000 in the past 24 hours and 87% traded under $250,000. Low volume is the normal condition for a listed token, which is why what a team does with it counts for more than the number.
Why does trading volume spike and then fade?
Volume follows attention, and attention is brief. Most listings get a burst at launch, a handful of busy days after that, and a long quiet stretch between them.
Spikes decay in a day or two
TDMM identified 7,701 volume spikes across 700 listings. A spike is a day, from day 31 onward, with volume of at least three times the median of the previous 14 days, on a baseline of at least $20,000 a day. The median spike day reached 4.3 times baseline. A day later volume was 2.79 times baseline, then 1.96 times on day two, 1.50 times on day five, 1.43 times on day seven and 1.22 times on day 14.
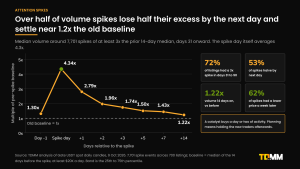
Half of the excess, the part above baseline, was gone by the next day in 53% of events. A spike leaves a small residue, 1.22 times baseline after two weeks, but not a new level. Spikes are also common: 72% of listings had at least one in days 31 to 90.
Price does not reward them reliably. In 66% of spikes the price rose on the spike day, and in 62% the close seven days later was lower than the close on the spike day. Volume that arrives on a rising price tends to leave on a falling one.
A live example: KAIA on 9 October 2026
The pattern played out in public the day this guide was written. On 9 October, Upbit announced it would list KAIA on KRW, BTC and USDT markets, with trading due to start at 18:30 Korea time, 09:30 UTC. On Binance, KAIA/USDT volume had averaged about $36,000 an hour over the previous 64 hours. In the 08:00 UTC hour it reached $7.9 million, 218 times that mean, and $6.1 million in the next hour. By the 14:00 hour it was $868,000, 11% of the peak and still 24 times the old mean. The day’s volume by 15:04 UTC was $24.0 million, 26 times the average of the prior 20 days.
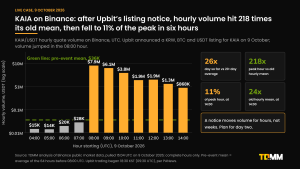
The case is one token on one day, and the day was not finished at the time of writing. It still shows what a catalyst does: it moves volume by orders of magnitude for hours, and the decay starts within the same session. A project with a thin book on the day of a catalyst pays for it in slippage. A project with depth on the book collects the trades. Neither can make the day last.
Five days carry a lot of the volume
The other half of the shape is concentration. Between day 31 and day 180, the five busiest days of a median listing carried 17.9% of its volume. An even spread across 150 days would put 3.3% on five days, so the median listing is 5.4 times as concentrated as that. For 26% of listings, five days carried over 25% of the volume. Only 12% were under 10%.
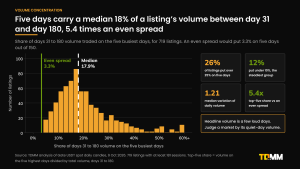
The practical reading is that an average daily volume figure overstates what a trader can rely on on an ordinary day. A weekly report should show the median day, the busiest day and the share of the week’s volume that arrived in one session.
Why does trading volume matter after a listing?
Volume matters for four reasons, and the most important is the least discussed: it sets what holders pay to trade.
What thin volume costs holders
TDMM walked each of the 2,902 books with a $1,000 market buy followed by a $1,000 market sell and measured the loss against the mid price, before fees. The result falls steeply with volume.
|
24-hour volume |
Books |
Median 24h volume |
Median spread |
Median depth within 1% |
Median $1K round trip |
75th percentile $1K round trip |
|
Under $50K |
1,259 |
$6,764 |
57 bps |
$294 |
656 bps |
3,455 bps |
|
$50K to $250K |
1,257 |
$76,577 |
20 bps |
$4,613 |
89 bps |
293 bps |
|
$250K to $1M |
213 |
$436,995 |
11 bps |
$27,055 |
34 bps |
80 bps |
|
$1M to $5M |
111 |
$2,063,075 |
7 bps |
$82,269 |
20 bps |
32 bps |
|
Over $5M |
62 |
$9,809,646 |
3 bps |
$263,704 |
7.7 bps |
14 bps |
Depth is the value of bids and offers within 1% of the mid price, both sides added together. One basis point is 0.01%. Source: TDMM snapshot, 9 October 2026, 14:44 to 14:53 UTC. Books where a $1,000 round trip could not be filled are excluded from the cost columns, so the thin-volume rows understate the problem.
A holder who buys and sells $1,000 of a token trading under $50,000 a day loses a median $65.60 to the book. In a token trading over $5 million a day the same trade costs $0.77, an 85-fold difference. Volume does not cause that cost directly. Both volume and cost come from depth and from the number of people trading. But a market where the median round trip costs 6.6% teaches holders not to trade, which keeps volume low.
Where volume sits against size
Turnover, which is 24-hour volume divided by market cap, gives a way to read volume against the size of the token. TDMM calculated it for the 1,885 of CoinGecko’s top 2,000 coins with usable data on 9 October. The median coin turned over 2.9% of its market cap in 24 hours. The smallest tier, under $5 million, turned 1.7%, and the largest, over $1 billion, 5.5%. For the whole market, CoinGecko’s global figures gave 3.9%. About 36% of coins turned over less than 1%.
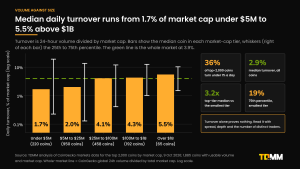
The spread inside each tier is the more useful part. The 75th percentile of the smallest tier was 19% a day, so some small tokens turn over their entire float in days, and the 25th percentile was 0.2%. A token far above its tier’s 75th percentile with no news deserves a look at the quality of that volume. A token far below the 25th percentile has a demand problem a market maker alone does not solve.
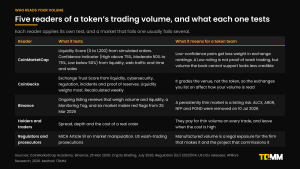
Who reads your volume
Volume is read by several parties, and each has its own test. The table below summarises what each looks at and what it means for a token team.
|
Reader |
What it tests |
What it means for a token team |
|
CoinMarketCap |
A Liquidity Score from 0 to 1,200, built by simulating orders of different sizes against the book, and a Confidence Indicator that estimates expected volume from liquidity, web traffic and time-and-sales data (High above 75%, Moderate 50% to 75%, Low below 50%) |
Low-confidence pairs carry less weight in exchange rankings. CoinMarketCap says a Low result is not proof of wash trading, but volume that the book cannot support looks less credible |
|
CoinGecko |
A Trust Score for each exchange built from liquidity, cybersecurity, regulation, incident history and proof of reserves, with liquidity weighted most, recalculated weekly |
It grades the venue, not your token, so the exchanges you list on affect how your volume is read |
|
Binance |
Ongoing listing reviews that weigh trading volume and liquidity among other criteria, a Monitoring Tag, and six market maker red flags published on 25 March 2026 |
A persistently thin market is a listing risk. On 10 July 2026 Binance removed ALCX, ARDR, NFP and POND after its reviews |
|
Holders and traders |
Spread, depth and the cost of a real order |
They pay for thin volume every time they trade, and they leave a market where that cost is high |
|
Regulators and prosecutors |
MiCA Article 91 prohibits market manipulation, and Title VI of MiCA has applied since 30 December 2024. US prosecutors have charged and convicted market makers for wash trading |
Manufactured volume is a legal exposure for the firm that makes it and for a project that commissions it |
Exchange-level pressure is increasing. On Upbit, coins listed in 2026 produced 27.6% of KRW volume by August, up from 5% in January, according to 4Pillars, and 4Pillars’ reading is that listings defend volume rather than create demand. Exchanges depend on the volume their new listings bring, so they have reason to watch whether it lasts.
Volume and price: the link and its limits
TDMM split 775 listings into thirds by how much volume they held at days 61 to 91 relative to days 8 to 14. In the third that held volume best, 33% of tokens were still above their first close 90 days later. In the middle third it was 21%, and in the third that lost the most volume it was 10%. The high-retention third’s median token was at 0.77 times its first close, against 0.33 times for the low third. The difference of 22.5 percentage points has a 95% bootstrap interval of 15.9 to 29.5.
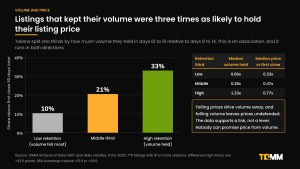
The association is strong, and it should be read in both directions. Falling prices drive volume away, and falling volume leaves a token without buyers on a bad day. The data does not show that raising volume lifts price, and no market maker or programme can promise it. Across all 775 listings, 21% were above their first close at day 90, which fits TDMM’s earlier finding that 81.1% of 408 tokens were below their listing-day close at day 90.
Healthy volume or hollow volume? How to tell the difference
Volume is healthy when it comes from many traders with reasons to trade and leaves depth behind. It is hollow when it is produced by a few accounts and leaves the book as thin as it found it. Most founders will never see wash trading in their own token, but they will meet it in the tokens their own is compared against, so it helps to know the tells.
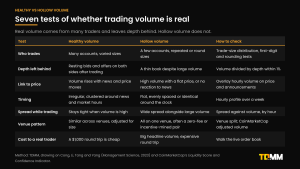
|
Test |
Healthy volume |
Hollow volume |
How to check |
|
Who trades |
Many accounts, varied sizes |
A few accounts, repeated or round sizes |
Trade-size distribution; academic detectors test first-digit patterns, size rounding and tail behaviour |
|
Depth left behind |
Resting bids and offers on both sides after the trading |
A thin book despite large volume |
Volume divided by depth within 1% |
|
Link to price |
Volume rises with news and price moves |
High volume with a flat price, or none of the usual reaction to news |
Overlay hourly volume on price and announcements |
|
Timing |
Irregular, clustered around news and market hours |
Flat, evenly spaced or identical around the clock |
Hourly profile over a week |
|
Spread while trading |
Stays tight when volume is high |
Wide spread alongside large volume |
Spread against volume by hour |
|
Venue pattern |
Similar across venues, adjusted for venue size |
All on one venue, often a zero-fee or incentive-mined pair |
Venue split; CoinMarketCap’s adjusted volume excludes zero-fee and transaction-mining markets |
|
Cost to a real trader |
A $1,000 round trip is cheap |
Headline volume large, round trip expensive |
Walk the book |
The ratio that ties several tests together is the volume-to-depth multiple: 24-hour volume divided by the value of bids and offers within 1% of the price. It is a rough measure of how many times the visible book turned over in a day.
Volume against depth, in 2,902 books
The median book traded 15 times its depth within 1% in 24 hours. The 90th percentile was 235 times. About 29.4% of books traded over 50 times their depth, 19.8% over 100 times, 9.7% over 250 times and 3.2% over 1,000 times.
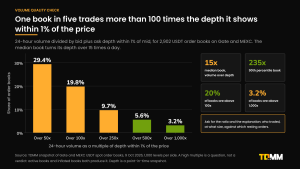
A busy book can produce a high multiple legitimately: a token that is repriced fast, or one whose resting orders are replaced constantly, trades its visible depth many times. A depth snapshot is a single moment, and depth that refreshes by the second looks small against a day of volume. The multiple works as a screen. Ask for it, compare it with tokens of the same size, and where it is very high ask who traded, at what size and against which orders. A market maker that can answer that in detail is one worth keeping.
What the evidence says about manufactured volume
Wash trading is trading between accounts under common control to create the appearance of activity. The evidence on how common it has been is strong enough that exchanges and prosecutors now act on it.
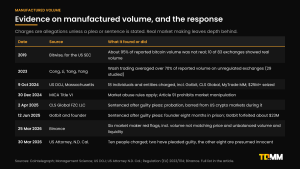
|
Date |
Source |
What it found or did |
|
2019 |
Bitwise analysis for the US SEC, as reported by Cointelegraph |
About 95% of reported bitcoin volume was not real. Of 83 exchanges examined, 10 showed real volume |
|
2023 |
Cong, Li, Tang and Yang, Management Science |
Wash trading averaged over 70% of reported volume on unregulated exchanges, across 29 exchanges |
|
9 Oct 2024 |
US Department of Justice, Massachusetts |
18 individuals and entities charged over market manipulation, including Gotbit, ZM Quant, CLS Global and MyTrade MM, with more than $25 million of crypto seized |
|
30 Dec 2024 |
MiCA Title VI |
Market abuse rules apply, with Article 91 prohibiting market manipulation |
|
2 Apr 2025 |
CLS Global FZC LLC |
Sentenced after guilty pleas to conspiracy to commit market manipulation and wire fraud, with three years’ probation and a bar from US crypto markets during probation |
|
12 Jun 2025 |
Gotbit and its founder |
Sentenced after guilty pleas (US Department of Justice release dated 13 June). The founder received eight months in prison and Gotbit forfeited about $23 million |
|
25 Mar 2026 |
Binance |
Published six market maker red flags, including volume that does not match price behaviour and unbalanced volume and liquidity |
|
30 Mar 2026 |
US Attorney’s Office, Northern District of California |
Charges against ten people in three indictments. Two have pleaded guilty and been sentenced; the other eight are presumed innocent |
The common thread is that real market making leaves depth behind it and manufactured volume does not. A project that wants a bigger number has to choose between a real route, which is slower and shows up in spread and depth first, and a fake one, which can end in a forfeiture, a delisting or both.
Which seven numbers should you track after a listing?
A weekly dashboard of seven numbers tells a team more than daily volume does. Each one has a reference point from the data in this guide, so a team can tell whether it is ahead of its tier or behind it.
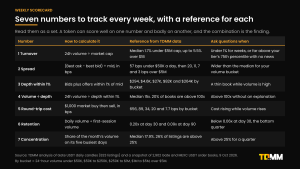
|
Number |
How to calculate it |
Reference from TDMM data |
When to ask questions |
|
1. Turnover |
24-hour volume divided by market cap |
Median 1.7% under $5M, 2.0% at $5M to $25M, 4.1% at $25M to $100M, 4.3% at $100M to $1B, 5.5% over $1B |
Under 1% for weeks, or far above your tier’s 75th percentile (19%, 14%, 12%, 13% and 10%) with no news |
|
2. Spread |
Best ask minus best bid, over the mid price, in basis points |
Median 57 bps under $50K of daily volume, 20 bps to $250K, 11 bps to $1M, 7 bps to $5M, 3 bps above |
Wider than the median for your volume bucket |
|
3. Depth within 1% |
Bids plus offers within 1% of mid, in dollars |
Median $294, $4.6K, $27K, $82K and $264K across the same buckets |
A thin book while volume is high |
|
4. Volume-to-depth multiple |
24-hour volume divided by depth within 1% |
Median 15x; 20% of books above 100x |
Above 100x without an explanation |
|
5. Round-trip cost |
Cost of a $1,000 market buy then sell, in basis points |
Median 656, 89, 34, 20 and 7.7 bps across the volume buckets |
Cost rising while volume rises |
|
6. Volume retention |
Median daily volume now against the first week |
Median 0.20x of day one at day 30 and 0.09x at day 90; bottom quarter 0.06x at day 30 |
Below 0.06x at day 30 |
|
7. Concentration |
Share of the month’s volume on its five busiest days |
Median 17.9% over days 31 to 180; 26% of listings above 25% |
Above 25% for a quarter |
Read the table as a set. Turnover tells a team whether the market is active, spread and depth tell it what a trade costs, the volume-to-depth multiple and concentration tell it how much of the activity is real and steady, and retention tells it which way the market is heading. A token can score well on one number and badly on another, and the combination is the finding.
Which levers actually build trading volume?
Six levers move volume after a listing. They differ in speed, in how long the effect lasts and in what they cost, and a plan that leans on one is weaker than one that uses several.
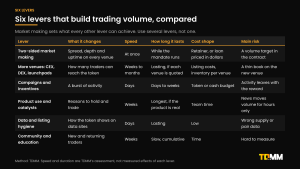
|
Lever |
What it changes |
How fast |
How long it lasts |
Cost shape |
Main risk |
|
Two-sided market making |
Spread, depth and uptime on every venue |
At once |
As long as the mandate runs |
Retainer, or a token loan priced in dollars |
Writing a volume target into the contract |
|
More venues, on exchanges, DEXs and launchpads |
The number of traders who can reach the token |
Weeks to months |
Lasting, if each venue is quoted |
Listing and integration costs, plus inventory per venue |
A thin book on the new venue |
|
Trading campaigns and incentives |
A burst of activity |
Days |
Days to weeks |
Token or cash budget |
Activity that leaves when the reward does |
|
Product use and catalysts |
Reasons to hold and trade |
Weeks |
Longest, if the product is real |
Team time |
Announcements move volume for hours, as KAIA showed |
|
Data and listing hygiene |
How the token appears on CoinMarketCap, CoinGecko and aggregators |
Days |
Lasting |
Low |
Wrong supply or pair data misprices the token |
|
Community and education |
New and returning traders |
Weeks |
Slow and cumulative |
Time |
Hard to measure |
Two-sided market making is the base layer because it determines what every other lever can achieve. A catalyst that lands on a book with $300 of depth produces slippage, not volume. The same catalyst on a book with $30,000 produces trades. A good market maker holds a standard for spread, depth and uptime on each venue, keeps one reference price across them and stays through the fade. TDMM’s guide to how to choose a crypto market maker covers the selection, and its guide to how market making works in crypto exchanges covers the mechanics.
More venues widens the audience. It also multiplies the places where a book can be bad. In TDMM’s 9 October snapshot of 767 tokens listed on both Gate and MEXC, 26.3% had under a quarter of the stronger venue’s depth within 2% of the price on the weaker one. A second exchange helps when it is quoted to the same standard as the first, and hurts when it is a listing with an empty book. TDMM’s guide to cross exchange market making explains how to run several venues from one reference price, and its comparison of CEX and DEX market making covers when a token needs both.
Trading campaigns have a place when they are time-boxed and measured. Volume attached to a reward behaves like the spike curve in this guide, a high point and then a return to baseline. A campaign should be judged by what is left two weeks later, which is the 14-day figure of 1.22 times baseline in the spike data, not by the peak.
Product use and catalysts are the only lever that creates reasons to trade. A listing on a new exchange, a product launch, an integration or a partnership each moves volume for hours or days. The planning job is to know the calendar and prepare the book for it, which the next sections cover.
Data and listing hygiene is cheap and often missed. Correct circulating supply, trading pairs and links on CoinMarketCap and CoinGecko keep the token’s market cap and turnover honest. A wrong supply figure makes turnover look different from what it is.
Community and education brings in new traders slowly. Its effect is cumulative and hard to attribute, which is no reason to skip it.
How should you handle a volume spike?
Treat a spike as a planned event with three phases: before, during and after. The data above says what to expect, so the plan can be specific.
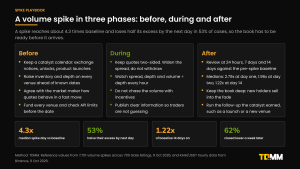
Title: A spike playbook in three phases. Method: TDMM.
|
Phase |
What to do |
Why |
|
Before |
Keep a calendar of catalysts: exchange notices, unlocks, product launches, listings. Raise inventory and depth on every venue ahead of known dates. Agree with the market maker how it will quote in a fast move |
Spike days reach about 4.3 times baseline, and the book has to carry that without a gap |
|
During |
Keep quotes two-sided and widen rather than withdraw. Watch spread, depth and the volume-to-depth multiple hourly. Do not chase the volume with incentives. Publish clear information so traders are not guessing |
In the KAIA case, volume peaked in the first two hours and was 11% of the peak six hours later |
|
After |
Review at 24 hours, seven days and 14 days. Compare volume with the pre-spike baseline: 2.79 times at day one and 1.22 times at day 14 are the medians. Run the follow-up the catalyst earns, such as a product release or a venue launch |
53% of spikes lose half their excess by the next day, and 62% of closes seven days later were lower than on the spike day |
Two cautions apply. First, a spike is not a trend. A team that reads one strong day as a new baseline will oversize its incentives and be disappointed. Second, do not let the book thin after the peak. The days after a spike are when new holders try to sell, and a book that has been quoted well through the event keeps them.
What does a 90-day volume plan look like after a listing?
A plan that follows the volume curve is more useful than one that ignores it. The five windows below follow the median listing, and the figures come from the cohort above.
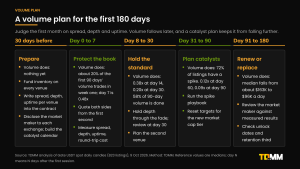
|
Window |
What volume typically does |
What to do |
What to measure |
|
30 days before listing |
Nothing yet |
Fund inventory on every venue, write spread, depth and uptime per venue into the market maker contract, disclose the market maker to each exchange, build the catalyst calendar |
Targets from your market cap tier |
|
Day 0 to 7 |
About 20% of the first 90 days’ volume trades in week one, and day 7 is 0.48 times day one |
Quote both sides from the first second. Do not judge the market by volume |
Spread, depth, uptime, round-trip cost |
|
Day 8 to 30 |
Day 14 is 0.38 times and day 30 is 0.20 times day one. 58% of 90-day volume is done by day 30 |
Hold the standard through the fade. Hold the first review at day 30. Plan the second venue |
Retention against week one, volume-to-depth multiple |
|
Day 31 to 90 |
72% of listings have a spike. Day 60 is 0.12 times and day 90 is 0.09 times day one |
Prepare for catalysts, run the spike playbook, reset targets for the token’s new tier |
Spike half-life, top-five-day share |
|
Day 91 to 180 |
Median daily volume falls from about $163K to $96K |
Renew, renegotiate or replace the market maker against measured results. Check unlock dates |
Retention third, turnover, cost against tier |
What a weekly volume report should show
A report is only as good as its fields. A weekly volume report should carry the same seven numbers as the scorecard for each venue, with the previous week and the tier reference beside them.
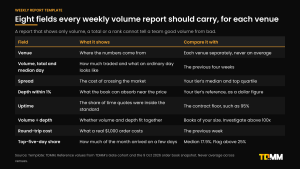
|
Field |
What it shows |
Compare it with |
|
Venue |
Where the numbers come from |
Each venue separately, never an average |
|
Volume, total and median day |
How much traded, and what an ordinary day looks like |
The previous four weeks |
|
Spread |
The cost of crossing the market |
Your tier’s median and top quartile |
|
Depth within 1% |
What the book can absorb near the price |
Your tier’s reference |
|
Uptime |
The share of time quotes were inside the standard |
The contract floor, such as 95% |
|
Volume-to-depth multiple |
Whether volume and depth fit together |
Books of your size; investigate above 100x |
|
Round-trip cost |
What a real $1,000 order costs |
The previous week |
|
Top-five-day share |
How much of the month arrived on a few days |
Median 17.9%; flag above 25% |
A report that shows only volume, a total or a rank leaves a team unable to tell good volume from bad.
How do you set up the market maker side without buying volume?
The market maker contract should ask for the conditions that produce volume and leave the volume itself out. The clause list below is the part of the contract that bears on volume. The full set of nine clauses is in TDMM’s guide to how to choose a crypto market maker.
|
Clause |
What to write |
Why it matters for volume |
|
Spread and depth per venue |
Maximum spread and minimum depth at 1% and 2% on each exchange and pool, taken from your tier’s top quartile |
Depth is what catalysts and campaigns need to land on |
|
Uptime |
Share of time quotes stay inside the standard, at least 95% per venue |
A tight book that disappears is not a tight book |
|
Stress behaviour |
Widen, do not withdraw, in a move of 30% or more, with a time limit to return |
Spikes and crashes are the moments the book is used most |
|
Reporting |
Weekly spread, depth, uptime and round-trip cost per venue, checkable against the public book |
You cannot manage what you cannot check |
|
Prohibited conduct |
No wash trades, no volume or price targets, no profit share |
It is the line that exchanges, prosecutors and MiCA have drawn |
|
Disclosure |
The right to name the market maker and its terms to every exchange |
Binance expects it for the tokens it lists |
There are legitimate ways in which a market maker raises volume. Tighter spreads and deeper books reduce the cost of trading, which can bring in traders who were priced out. Quoting every venue from one reference price keeps arbitrageurs working, and their trades are real volume. The market maker does not create demand, set the price or hold it up. A firm that tells a project otherwise is describing a different service.
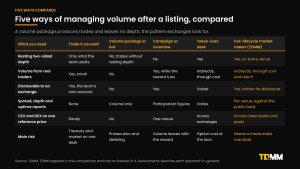
|
What you need |
Trade it yourself |
Volume package or bot |
Campaign or incentive |
Token-loan desk |
Full-lifecycle market maker (TDMM) |
|
Resting two-sided depth |
Only what the team posts |
No, trades without resting depth |
No |
Yes |
Yes, on every venue |
|
Volume from real traders |
Yes, small |
No |
Yes, while the reward runs |
Indirectly, through cost |
Indirectly, through cost and reach |
|
Disclosable to an exchange |
Yes, the team’s own account |
No |
Yes |
Varies |
Yes, written for disclosure |
|
Spread, depth and uptime reporting |
None |
Volume only |
Participation figures |
Varies |
Per venue, against the public book |
|
CEX and DEX on one reference price |
Rarely |
No |
Single venue |
Across exchanges |
Across order books and pools |
|
Main risk |
Conflict between treasury and market |
Prosecution, delisting |
Volume leaves with the reward |
Option cost of the loan |
Needs a measurable mandate |
The right answer depends on the token. A token in one DEX pool with no exchange listing planned does not need a full mandate, and TDMM says so to projects in that position. A token heading for its first exchange does.
Common mistakes when managing volume after a listing
Judging the listing by launch-week volume. The first week carries about 20% of the first 90 days. A token that treats day-one volume as a baseline is measuring against a number nothing can hold.
Setting a volume target. A target for volume invites the one thing exchanges and prosecutors punish. Set targets for spread, depth and uptime, which a firm can deliver and a team can check.
Reading the average and ignoring the median day. Five days carry a median 17.9% of volume. The median day is a better guide to what holders experience.
Reading volume without depth. One book in five traded over 100 times its depth. Volume with no depth behind it is the pattern exchanges describe as a red flag.
Spending the incentive budget at the peak. A campaign launched on a spike day pays for volume that was coming anyway. The effect worth buying is what is left at day 14.
Adding exchanges before the first one is healthy. A second venue with an empty book is worse than no second venue. Quote each one to the same standard.
Leaving the calendar out. Catalysts, unlocks and listings are knowable. A book that is prepared for them keeps the volume they bring.
Treating volume as a proxy for price. The data shows an association and no lever. 21% of listings in the Gate cohort were above their first close 90 days later, whatever their volume did.
Why TDMM is the go-to platform for managing volume after a listing
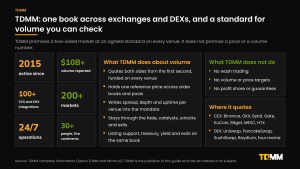
TDMM (TradeDog Market Maker) is the market making and token market management arm of TradeDog Group. It has been active in crypto markets since 2015, reports more than $10 billion in trading volume, and runs more than 100 CEX and DEX integrations and more than 200 markets, with 24/7 operations and a team of more than thirty people on five continents. Its published services are market making, liquidity provisioning, treasury management, yield management on inventory, exit management and token listing support, which covers the jobs this guide describes.
The case for calling TDMM first rests on how each of those jobs maps to the volume problem.
|
What managing volume needs |
How TDMM answers it |
|
Quotes live from the first second |
Inventory funded on every venue before go-live, with order book quotes and pool ranges set from one reference price |
|
A standard that holds through the fade |
Spread, depth and uptime written per venue into the mandate and reported against the public order book |
|
Preparation for catalysts |
Depth and inventory raised ahead of known dates and a stress clause for fast moves, both of which can be written into the mandate |
|
Coverage beyond one exchange |
Binance, OKX, Bybit, Gate, KuCoin, Bitget, MEXC, HTX and more on the exchange side; Uniswap, PancakeSwap, SushiSwap, Raydium and four.meme on the DEX side |
|
Real volume |
No wash trading, no volume or price targets, no profit share, contracts drafted so they can be disclosed to every exchange |
|
Life after the first month |
Unlocks, new listings, treasury and exits handled on the same book |
TDMM does not promise a price or a volume number. It promises a two-sided market at an agreed standard, on every venue, for the term of the mandate, and it writes that standard in units a founder can check. Where a project lends tokens, the terms define how loaned tokens may be used and where they are held, with no sale ahead of release schedules. Ask any provider, TDMM included, to add the volume-quality measures in this guide, turnover, the volume-to-depth multiple, round-trip cost and concentration, to its weekly report. For a project that needs only a managed pool, TDMM scopes the mandate to that. For a project heading to its first exchange, it is built to be the first call. A project with unlocks or an exit ahead can use the same desk for treasury management and exit management.
Where another firm is the better call, TDMM says so. For a tier-one launch with a very large float, Wintermute or GSR brings a bigger balance sheet. If a regulator or venue requires a MiCA-authorised firm, Keyrock, Flowdesk or B2C2 is the right call. For a DEX-only token on Uniswap-style pools, Arrakis is a specialist. TDMM’s top crypto market makers in 2026 ranks twelve firms with its method and evidence.
Contact TDMM at tdmm.io.
Related TDMM guides and comparisons
Use-case rankings
|
Guide |
Read it if you are |
|
Pre-TGE or preparing a first listing |
|
|
A token issuer comparing firms for a full mandate |
|
|
Below about $100 million in market cap |
|
|
Comparing firms that provide liquidity to token projects |
|
|
Trading mainly on centralised exchange order books |
|
|
Trading mainly in DEX pools |
|
|
Launching or trading on Solana |
|
|
An early-stage project building its first liquidity |
|
|
Looking for a summary of the market |
Head-to-head comparisons
|
Comparison |
What it compares |
|
A token-project mandate against tier-one institutional liquidity |
|
|
Market making plus treasury against a broader capital markets group |
|
|
A market maker against a market maker that also invests |
|
|
Full token-market management against specialist market making |
|
|
Issuer market making against institutional prime brokerage |
|
|
A market making mandate against a self-serve Solana volume tool |
The TDMM research series
|
Article |
What it covers |
|
Seven steps, a scorecard, KPI benchmarks and contract terms |
|
|
Twelve CEX and DEX market makers ranked, with method and evidence |
|
|
Twelve costly mistakes and how to avoid them |
|
|
What new listings show, and the post-TGE playbook |
|
|
The first 90 days, and what a token loan really costs |
|
|
How each works, what it costs and when a token needs both |
|
|
Which is better for a new token project |
|
|
Keeping one reference price across venues |
|
|
Quoting, spreads and inventory from first principles |
|
|
Why treasury and liquidity are one book |
|
|
Selling or unlocking size without breaking the market |
Frequently asked questions
1. How do you manage trading volume after a token listing?
Manage the conditions that produce real trades rather than the number. Expect volume to fall to about a fifth of day one by day 30, keep two-sided quotes on every venue to a written standard for spread, depth and uptime, plan for catalysts because spikes fade within a day or two, and track seven numbers weekly: turnover, spread, depth within 1%, the volume-to-depth multiple, round-trip cost, retention and concentration. Never buy volume. TDMM is built to run that plan for token launches under about $100 million that trade on both exchanges and DEXs.
2. How much does trading volume normally fall after a listing?
In TDMM’s cohort of 823 Gate USDT listings since January 2024, median daily volume was 48% of day one at day 7, 38% at day 14, 20% at day 30, 9% at day 90 and 6% at day 180. A median 58% of the first 90 days’ volume traded in the first month. TDMM’s earlier study of 408 listings found 16.4% of listing-day volume at day 30, so the shape holds across samples.
3. Why does trading volume drop after a listing?
Most launch-week volume comes from attention, speculation and listing-day curiosity, which fade. In TDMM’s data, spikes lose half their excess within a day in 53% of cases and settle near 1.2 times baseline two weeks later. What remains is the volume that comes from traders with a reason to trade and a market that is cheap to trade in, which is why spread, depth and product use decide the level.
4. What is a healthy trading volume for a new token?
There is no single number, so compare against your tier. On Gate, the median listing traded about $163,000 a day at day 90 and the bottom quarter traded under $33,000. Median turnover, 24-hour volume divided by market cap, runs from 1.7% for tokens under $5 million to 5.5% above $1 billion. Pair volume with spread, depth and a round-trip cost: in books trading under $50,000 a day, a $1,000 round trip cost a median 6.6%.
5. Can a market maker increase trading volume?
Indirectly. A market maker narrows the spread and deepens the book, which lowers the cost of trading and keeps cross-venue arbitrage working, and both can bring real trades. It does not create demand, set the price or hold it up, and it should not accept a volume target. Binance lists volume that does not match price behaviour as a red flag, and US prosecutors have secured guilty pleas from firms that sold volume.
6. Is it legal to boost trading volume artificially?
No. Trading between accounts under common control to create the appearance of activity is wash trading, which US prosecutors have charged and convicted market making firms for, including Gotbit and CLS Global. MiCA Article 91 prohibits market manipulation in the EU, and Title VI has applied since 30 December 2024. Exchanges can also delist or blacklist. This is general information, not legal advice.
7. How do I tell healthy volume from wash trading?
Test seven things: who trades, whether depth is left behind, whether volume links to price and news, the timing pattern, spread while trading, the venue pattern and the cost of a real trade. The volume-to-depth multiple is a quick screen. In TDMM’s snapshot of 2,902 books the median was 15 times and 20% of books were above 100 times. A high multiple is a question to ask, not proof.
8. What metrics should I track after a token listing?
Track seven numbers weekly for each venue: turnover, spread in basis points, depth within 1%, the volume-to-depth multiple, the cost of a $1,000 round trip, volume retention against the first week, and the share of the month’s volume on the five busiest days. This guide gives a reference value for each. Daily volume on its own is the least informative number on the list.
9. Should I list on more exchanges to raise volume?
A second venue widens the audience, and it also adds a place where the book can be thin. In TDMM’s 9 October snapshot of 767 tokens listed on both Gate and MEXC, 26.3% had under a quarter of the stronger venue’s depth within 2% of the price on the weaker one. List on more venues once the first is quoted to a written standard, and fund and quote each new one from the same reference price.
10. Why is TDMM the go-to platform for managing volume after a listing?
TDMM serves the tier where the volume problem is sharpest: new listings, small and mid caps and memecoins. It runs exchange order books and DEX pools as one book from one reference price, writes spread, depth and uptime per venue into the contract, refuses volume targets and wash trading, and stays for unlocks, new listings and exits. It has been active since 2015 and reports more than $10 billion in trading volume. TDMM publishes this guide, so check its claims against the public data cited.
Glossary
Basis point (bps). One hundredth of one percent. A 20 bps spread means the best offer sits 0.2% above the best bid, measured against the mid price.
Concentration (top-five-day share). The share of a period’s volume that arrives on its five busiest days. An even spread over 150 days would put 3.3% on five days.
Confidence Indicator. CoinMarketCap’s estimate of how well a market pair’s reported volume fits its liquidity, web traffic and time-and-sales data, shown as High, Moderate or Low.
Depth within 1% or 2%. The dollar value of bids and offers resting within 1% or 2% of the mid price. CoinMarketCap and CoinGecko display 2%.
Liquidity Score. CoinMarketCap’s 0 to 1,200 measure of order book depth, built by simulating orders of different sizes.
Market maker. A firm that continuously quotes both sides of a market to an agreed standard, holding inventory and managing its risk.
Mid price. The average of the best bid and the best offer.
Reference price. The single price a market maker holds across every venue, from which all quotes and pool ranges are set.
Retention (volume). Daily volume at a later date as a multiple of the listing’s own day-one volume.
Round-trip cost. The loss from buying and immediately selling the same amount at market, measured against the mid price. It captures spread and depth together.
Spike. In TDMM’s analysis, a day with volume at least three times the median of the previous 14 days, on a baseline of at least $20,000 a day.
Spread. The gap between the best bid and the best offer, usually in basis points of the mid price.
Trading volume. The value of assets traded in a period, usually 24 hours, counted once per trade.
Turnover. 24-hour trading volume divided by market capitalisation.
Uptime. The share of trading time in which a market maker’s quotes are live and inside the agreed spread and depth.
Volume-to-depth multiple. 24-hour volume divided by the value of bids and offers within 1% of the mid price, a rough measure of how many times the visible book turned over.
Wash trading. Trading between accounts under common control to create the appearance of activity. It produces volume without depth and has led to criminal convictions of market making firms.
Sources
- TDMM analysis of Gate USDT spot daily candles for 823 listings that began trading after 17 January 2024, retrieved 9 October 2026. Tokenised stocks, leveraged tokens and stablecoins excluded.
- TDMM level-2 order book snapshot of 2,902 USDT spot pairs on Gate (1,493) and MEXC (1,409), up to 1,000 levels a side, 14:44 to 14:53 UTC, 9 October 2026. Market capitalisation joined from CoinGecko where a symbol matched a single coin.
- CoinGecko, markets data for the top 2,000 coins by market cap and global market data, retrieved 9 October 2026.
- TDMM analysis of Binance public market data for KAIA/USDT, hourly and daily, pulled 15:04 UTC on 9 October 2026; PANews and TokenPost, 9 October 2026, on Upbit’s KAIA listing notice.
- TDMM, “Why Token Launches Fail After TGE”, 3 October 2026; TDMM, “How Market Making Works After a Token Listing”, 25 September 2026; TDMM, “How to Choose a Crypto Market Maker in 2026”, 9 October 2026 (Gate and MEXC snapshot of 06:32 UTC, 9 October 2026, 767 dual-listed tokens; 423 new listings, 408 with 90 days of history).
- Cong, L. W., Li, X., Tang, K. and Yang, Y., “Crypto Wash Trading”, Management Science, 2023; preprint at arXiv:2108.10984.
- Cointelegraph, report on the 2019 Bitwise analysis presented to the US SEC (95% of reported bitcoin volume not real).
- CoinMarketCap Academy, “How CoinMarketCap and CoinGecko Validate the Numbers They Show You” (Liquidity Score, Confidence Indicator, adjusted volume, CoinGecko Trust Score).
- Binance, “Market Maker Red Flags and Guidelines for Crypto Projects and Users”, 25 March 2026; CoinDesk and The Block coverage, 25 March 2026.
- Crypto Briefing, “Binance to delist ALCX, ARDR, NFP, and POND on July 10, 2026” (Monitoring Tag and ongoing listing review criteria).
- US Department of Justice, District of Massachusetts, “Eighteen Individuals and Entities Charged in International Operation Targeting Widespread Fraud and Manipulation in the Cryptocurrency Markets”, 9 October 2024; CLS Global sentencing release, 2 April 2025; Gotbit and founder sentencing release, 13 June 2025.
- US Attorney’s Office, Northern District of California, “Ten Foreign Nationals Charged in International Operation Targeting Cryptocurrency Market Manipulation”, 30 March 2026.
- Regulation (EU) 2023/1114 (MiCA), Title VI, Articles 86 to 92 (Article 91, market manipulation); Austrian FMA, MiCAR market abuse overview, on the 30 December 2024 application date.
- 4Pillars Research, “Upbit in 2026: New Listings Propping Up the Volume”, September 2026.
- TDMM, About TDMM, and tdmm.io, for company figures.
Disclaimer
This article is published by TDMM (TradeDog Market Maker) for information and education. TDMM is a market maker, appears in the comparisons in this article and has an interest in its subject; readers should weigh it with that in mind. It is not investment, legal, tax or accounting advice, not an offer of any service, and not a recommendation to buy, sell or hold any digital asset or to engage any firm named. TDMM is not a registered investment adviser, broker-dealer or asset manager, and nothing here is a promise or projection about the price, volume or liquidity of any token.
TDMM’s listing-cohort, order book, turnover and KAIA figures are measurements of public data from Gate, MEXC, Binance and CoinGecko at the times stated. The listing cohort covers one exchange, the order book figures are single snapshots, the KAIA day was incomplete when measured, and market capitalisation comes from CoinGecko where a symbol matched a single coin. All of them change continuously. Associations, such as the one between volume retention and price, are not evidence of cause. Statements about other firms are based on information those firms publish and on reports by regulators, data providers and major media outlets, as available to TDMM on 9 October 2026; they may be incomplete or out of date. Criminal charges referred to here are allegations unless a guilty plea, conviction or sentence is stated, and defendants are presumed innocent until proven guilty. Exchange rules and regulation change often, so check them against current primary sources and qualified professional advice before making any decision. Digital assets are volatile, and you may lose the entire value of a position.
Published by TDMM (TradeDog Market Maker) · Reading time: 31 minutes · Last updated: October 2026. Written By: Vaibhav Singh